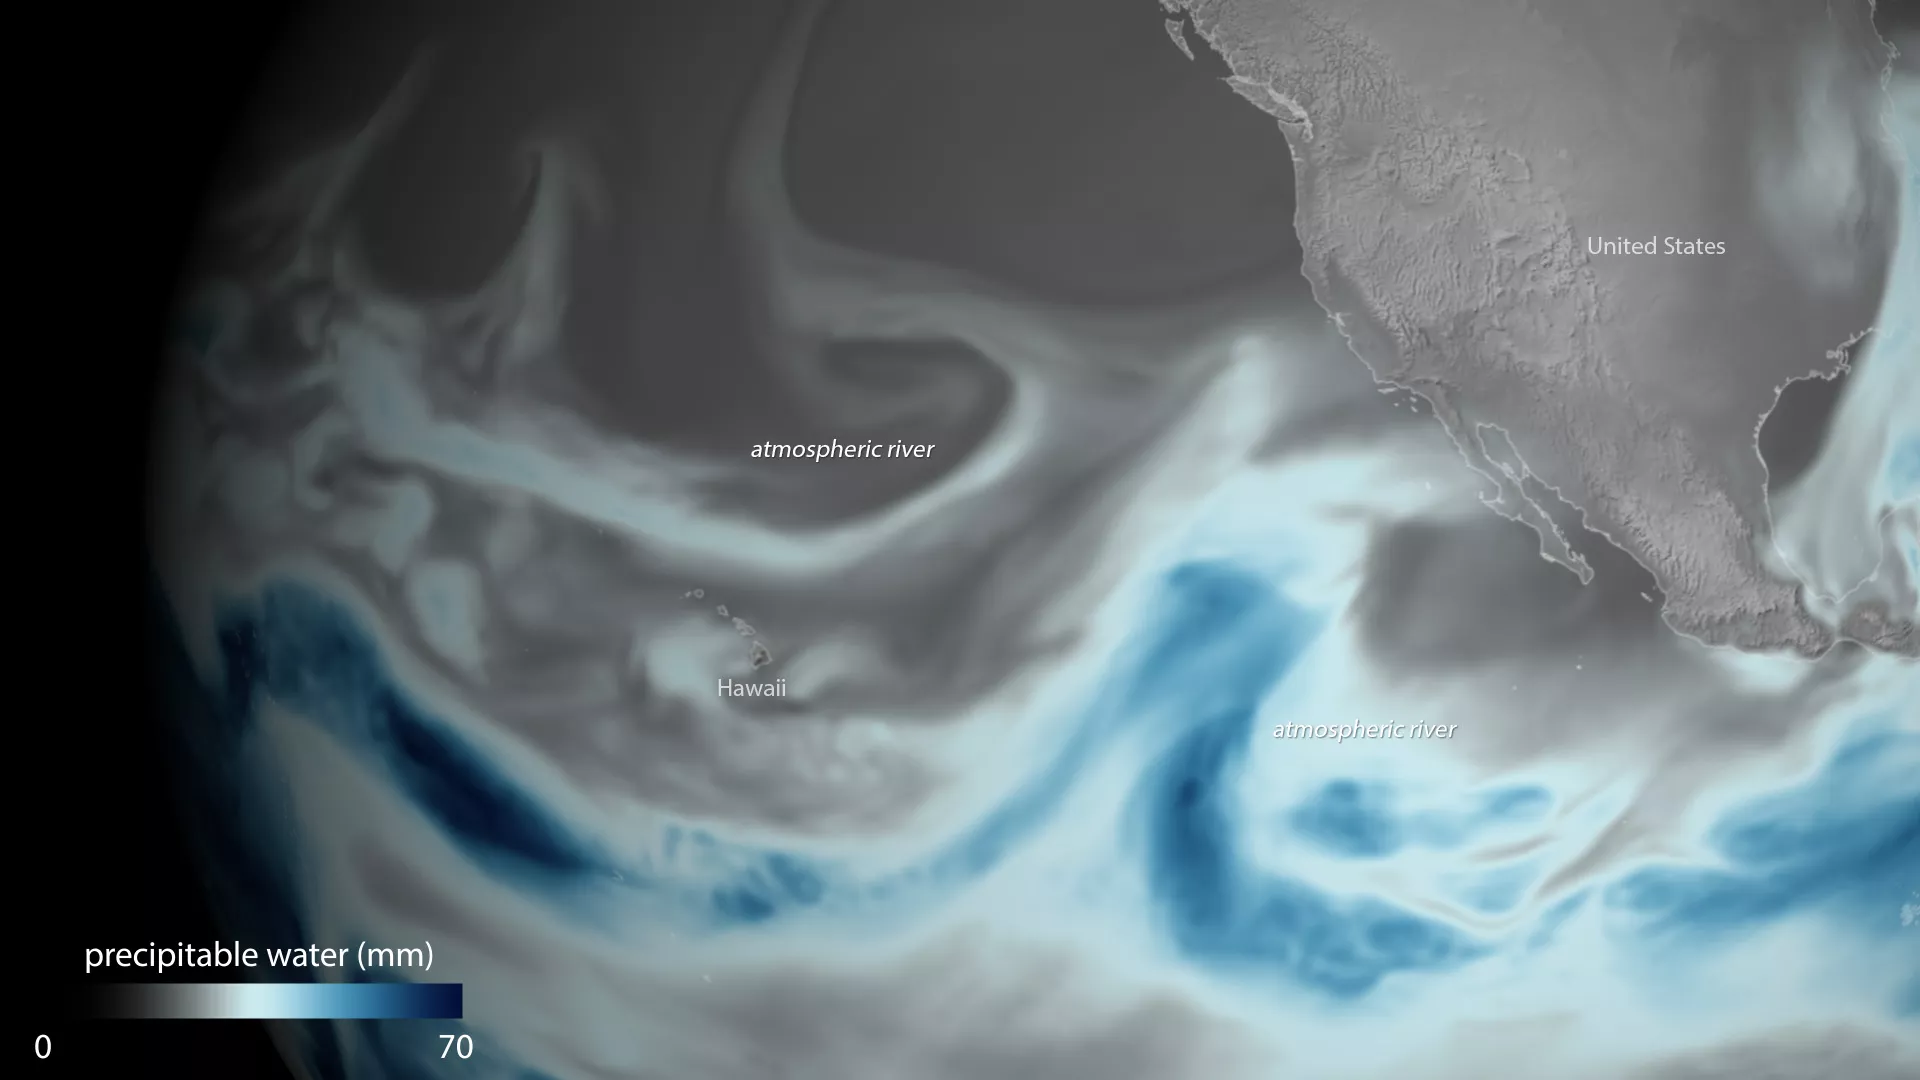
Created with data from the Global Forecast System (GFS) model, this data visualization shows atmospheric moisture over the central Pacific Ocean on January 3. Satellites can detect this moisture and the data can then be used to calculate what's known as the "total precipitable water" content of the atmosphere. The total precipitable water content is the amount of water that could potentially precipitate if the conditions were ideal. Visible in this data imagery are the bands of moisture that encircle the equator, along with so-called " atmospheric rivers " that transport moisture from these areas to higher latitudes.
Note the larger of the two atmospheric rivers in this graphic is responsible for the heavy precipitation occurring in parts of the West this week. This graphic was created with data from the Global Forecast System mathematical model, which is used by the National Weather Service to produce forecasts up to 16 days in advance. The GFS is produced by NOAA's National Centers for Environmental Prediction. It contains dozens of atmospheric and land-soil variables ranging from temperatures, winds, and precipitation to soil moisture and atmospheric ozone concentration.