

The Earth's atmosphere primarily consists of nitrogen and oxygen, with the remainder being trace gases that account for less than 1% by volume. Hundreds of trace gases exist, produced through natural processes like photosynthesis and volcanic eruptions, and through anthropogenic processes like the burning of fossil fuels and management of livestock manure, among others. Trace gases are essential for life, as they help keep the Earth warm and protect its inhabitants by absorbing harmful solar radiation. But despite their relatively minor abundance in the atmosphere, many trace gases play a significant role in global air quality and climate change.
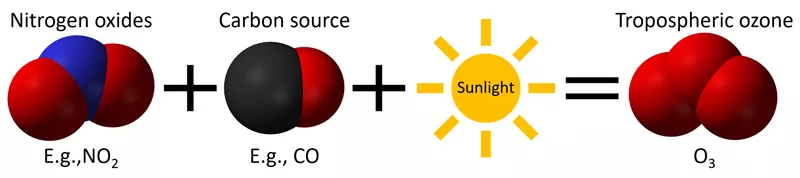
Take ozone, for example: Stratospheric ozone is critical for blocking harmful ultraviolet radiation from the Sun. But tropospheric (ground-level) ozone—formed through chemical reactions with other pollutants—is unhealthy to humans and the environment and is the main ingredient in smog. Wildfires also emit many trace gases that are ozone precursors—carbon monoxide, methane, nitrogen oxides, and others—making fires “quite relevant for air quality for both ozone and particulates,” says Dr. R. Bradley Pierce, Director of the Space Science and Engineering Center (SSEC) at the University of Wisconsin-Madison. And because wildfire smoke can travel hundreds and even thousands of miles from its source, the impacts to air quality are often felt around the globe.


Surface-level pollutants at unhealthy levels can trigger chest pain, coughing, throat irritation, and congestion in even the healthiest of individuals. It’s not only human health impacts that are worrisome: The economic cost of wildfire smoke can be great. One recent study suggests a 13% loss in earnings linked to drifting smoke plumes because lingering health impacts and other issues reduce worker productivity, lead to premature mortality, and decrease tourism. Another study estimates the value of health impacts from short-term smoke exposure in the continental U.S. at around $79 billion per year. Statistics like this drive home the importance of accurate air quality forecasting so that timely alerts can be issued, and steps can be taken to lessen exposure.
Researchers and air quality forecasters rely on Earth system models that assimilate trace gas measurements from satellite instruments to simulate atmospheric chemistry and predict large scale pollution events. One of these is the Real-time Air Quality Modeling System (RAQMS), a chemistry and aerosol analysis and forecast system that has provided real-time predictions of global air quality since 2012. Supported by the Office of Low Earth Orbit (LEO) Observations Proving Ground and Risk Reduction (PGRR) program, Dr. Pierce and his team at SSEC have been assimilating satellite data into the RAQMS modeling system. This includes data derived from the Joint Polar Satellite System (JPSS) Ozone Mapping and Profiling Suite (OMPS) and the Cross-track Infrared Sounder (CrIS), which measure atmospheric ozone and other trace gases.

The SSEC team is integrating JPSS and other satellite-based observations into the RAQMS system to make atmospheric simulations more accurate and reflective of real-world conditions. The goal is to improve the modeling system’s performance, particularly in estimating the vertical distribution of atmospheric pollutants. These advancements are crucial for enhancing regional air quality forecasts and providing situational awareness, especially for National Weather Service (NWS) Incident Meteorologists who rely on this information during emergencies such as wildfires.
Explore the 2023 JPSS Annual Science Digest to learn more about the importance of monitoring natural gas flares, the science behind the VIIRS Nightfire product, and how scientists and others use the tool to detect flares and other combustion sources. The JPSS Annual Science Digest offers an in-depth look into many JPSS products, innovative applications of JPSS data, and the benefit of JPSS to society.