

Phenomena: Flooding
Satellites: NOAA-20, NOAA-21, Suomi NPP
Instrument: Visible Infrared Imaging Radiometer Suite (VIIRS)
Product: VIIRS Floodwater Depth
Date: April 7, 2025
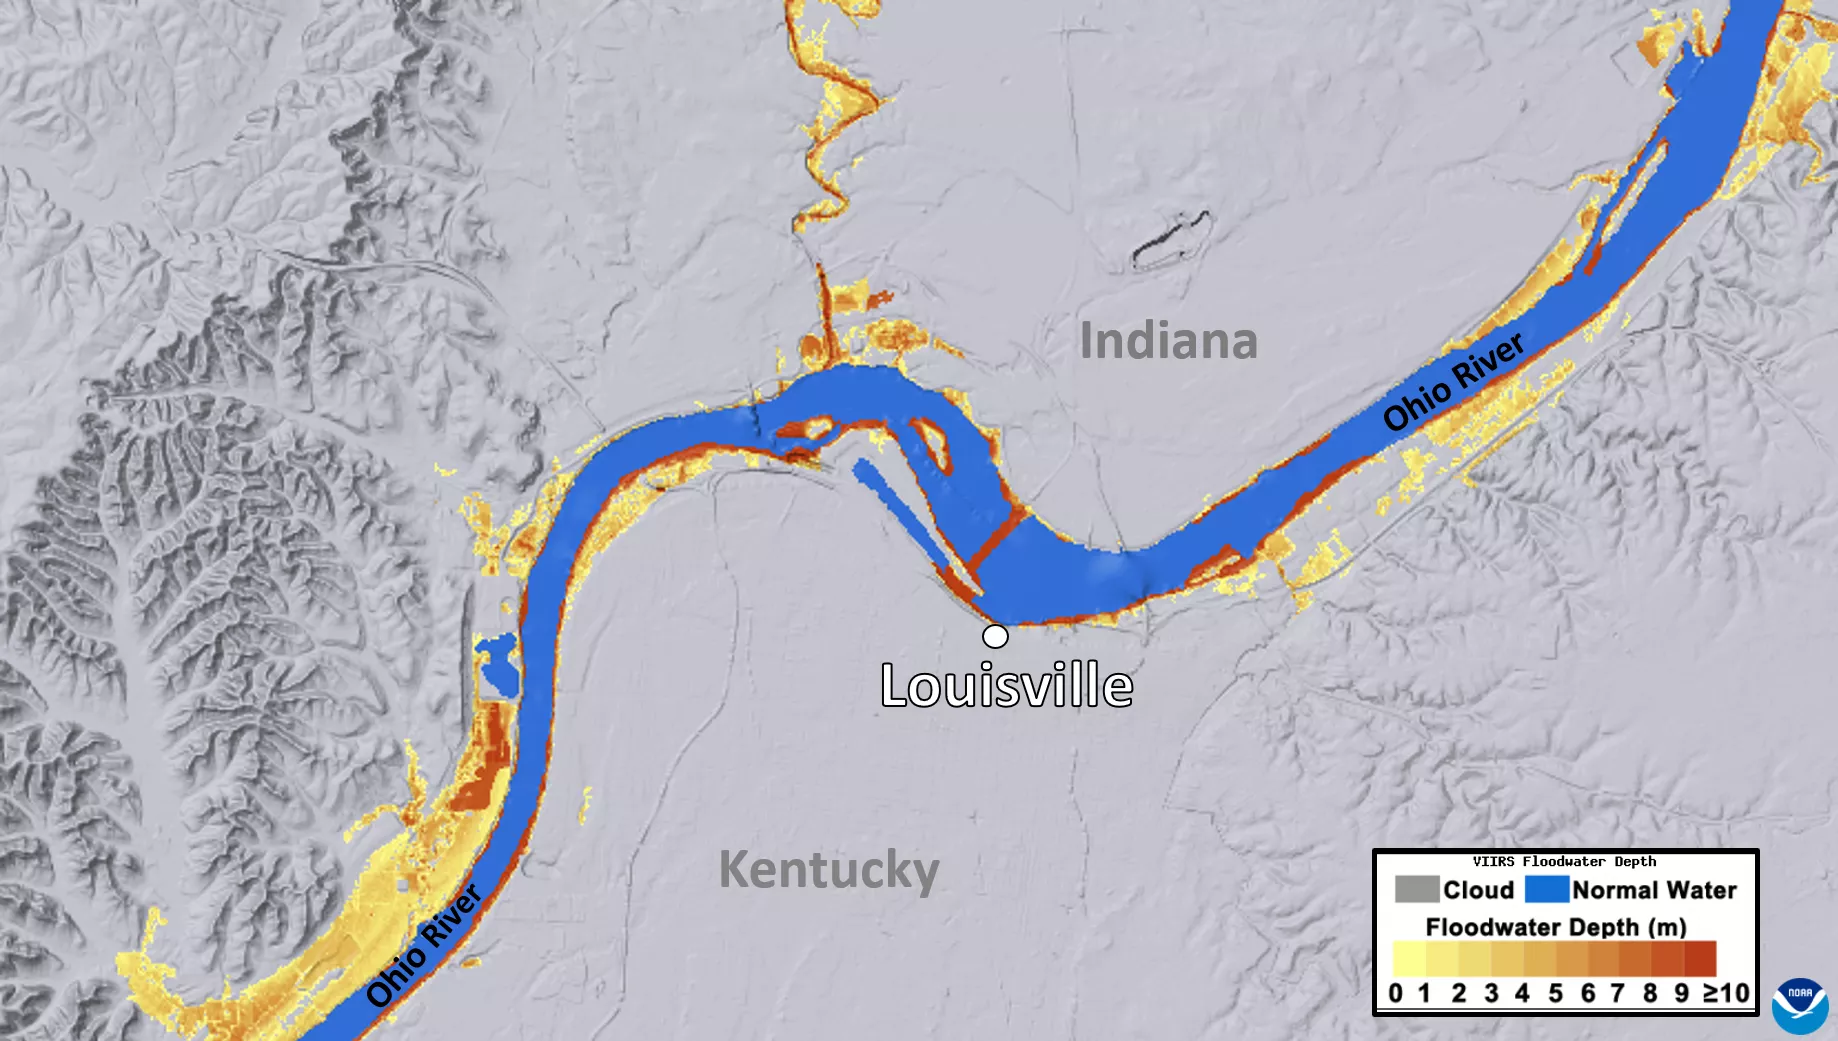
This imagery of the Ohio River Valley shows the extent and depth of the river flooding around the Louisville, Ky., metropolitan region from earlier this week. This image was taken on April 7, 2025, during a period of clear skies after several days of very heavy rain fell across the Ohio Valley.
The legend on the lower-right indicates the various depths of flooding along the river, in meters. The yellow and orange shading indicates several meters of water, with red showing total water depths of more than 9 meters (~30 feet).
The depth of the river at the McApline Upper river gauge, located near downtown Louisville, normally sits around 12 feet. On April 7, the gauge recorded water levels of around 34 feet, with the Ohio River finally cresting at 36.63 feet on the morning of April 9. This ranks among the Top-10 worst floods in Louisville's history. At this depth, many roads near the river are under water and the floodwalls at downtown Louisville’s 2nd and 11th Streets are closed.
This composite image was captured by NOAA’s Joint Polar Satellite System (JPSS) Program’s VIIRS instrument, which scans the entire Earth twice per day at a 750-meter resolution. NOAA-20, along with NOAA-21, and the NOAA/NASA Suomi NPP make up NOAA’s JPSS Program, the Nation’s advanced series of polar-orbiting environmental satellites. These data are critical to the timeliness and accuracy of forecasts three to seven days in advance of a severe weather event. JPSS is a collaborative effort between NOAA and NASA.