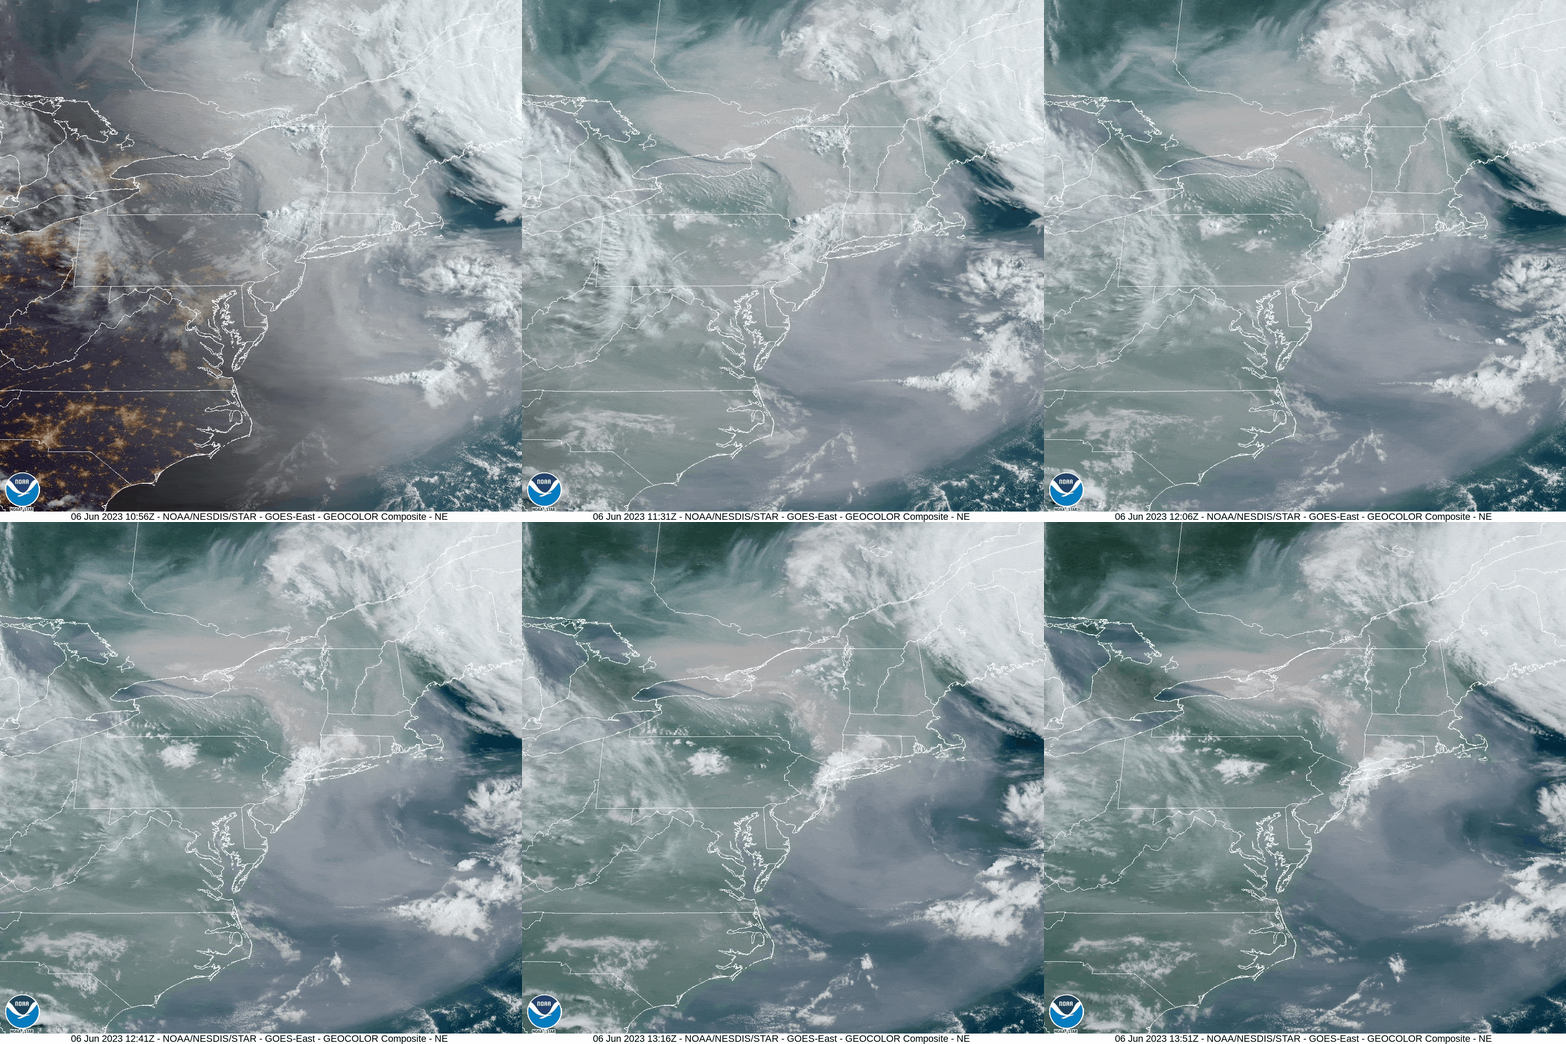
NOAA satellites provided critical data for air quality forecasters when wildfires, burning near Quebec, Canada, sent billowing plumes of smoke over the eastern United States. The satellite data allowed NOAA scientists to estimate that more than 86 million people experienced fine particulate pollution levels higher than the federal health standard
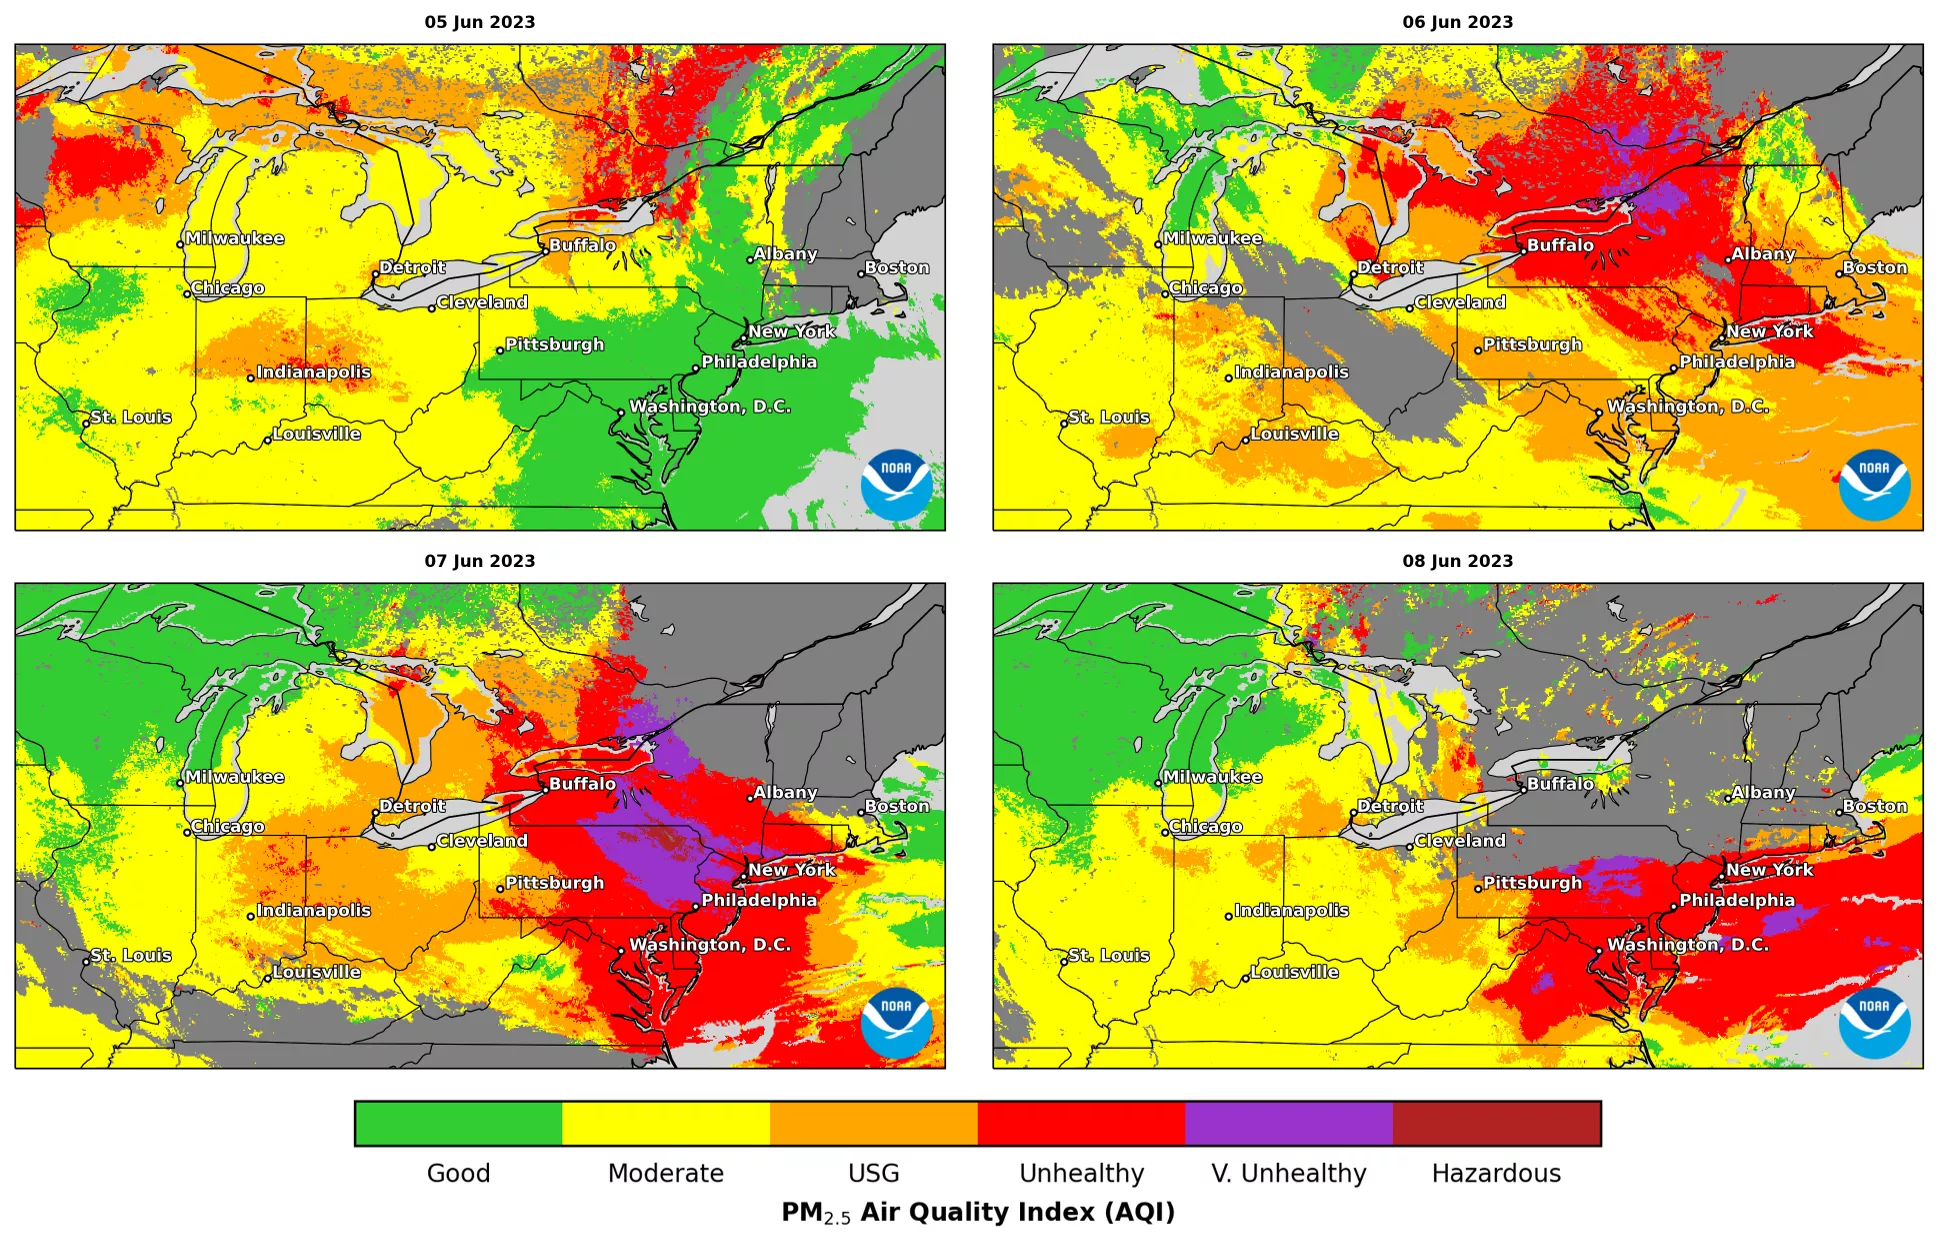
Observations from the Advanced Baseline Imager on the GOES East satellite tracked the progression of the worst air quality, shown by the red, purple, and maroon shading in the figure below, starting in the Great Lakes on June 5 and moving to New York State and southern New England on June 6, then pushing southward into the Mid-Atlantic region on June 7–8. These historic fine particulate pollution levels were the highest recorded for many cities, including New York City, Philadelphia, and Washington, D.C.
Extreme wildland fires have become the norm rather than the exception in recent years, with many wildfires being ignited by lightning in a warming and drying climate. The impacts of smoke in the U.S. mostly have been experienced by those in the western states, particularly in California, Oregon, and Washington, where residents have suffered very high levels of pollution from wildfires. In contrast, the eastern U.S. had largely escaped the effects of wildfire smoke on air quality, until recently.
During the early-June episode, NOAA satellite observations of the smoke helped forecasters issue air quality alerts to protect public health. “Satellite resources, such as NOAA’s AerosolWatch website, provide operationally critical, real-time information on smoke content in the atmosphere and vital lead time for us to communicate impending impacts to surface air quality,” said Joel Dreessen, Air Quality Forecaster at the Maryland Department of the Environment.
“The last major smoke episode of a similar magnitude that impacted air quality in the eastern U.S. occurred in July 2002, over 20 years ago,” said Amy Huff, Ph.D., of IM Systems Group, who supports NOAA’s Center for Satellite Applications and Research (STAR)’s air quality work. But last week’s event is unlikely to be a rare occurrence. Smoke transport from wildfires is expected to become more frequent in the eastern U.S., where it will have a greater impact on public health because of the region’s many dense urban population centers.
“NOAA’s geostationary satellite data of fine particulate pollution increasingly are being used in nowcasting mode to provide warnings to the public,” said Shobha Kondragunta, Ph.D., who leads the air quality studies at STAR. In addition, NOAA satellite observations of wildland fires provide critical input to forecast models on fire locations and the amount of smoke and other pollutants emitted by wildfires that impact air quality downwind.
“Our operational air quality forecast models use these satellite observations as input to predict the impact of wildfires on air quality,” said Ivanka Stajner, Ph.D., Deputy Director of the Environmental Modeling Center at NOAA’s National Weather Service (NWS). The operational air quality forecast guidance is produced by NWS twice daily and is used by state and local air quality forecasters to issue air quality alerts to states and 360 cities and counties nationwide to help protect people from harmful exposure to smoky air. Air quality forecasts and current nowcast observations are available on AirNow.gov
“These satellite data are also used extensively by NOAA researchers to improve the treatment of smoke emissions, plume transport, and atmospheric chemistry in the next-generation air quality forecasting systems,” said Gregory Frost, Ph.D., Supervisory Research Chemist in the Chemical Sciences Laboratory of NOAA’s Office of Oceanic and Atmospheric Research.
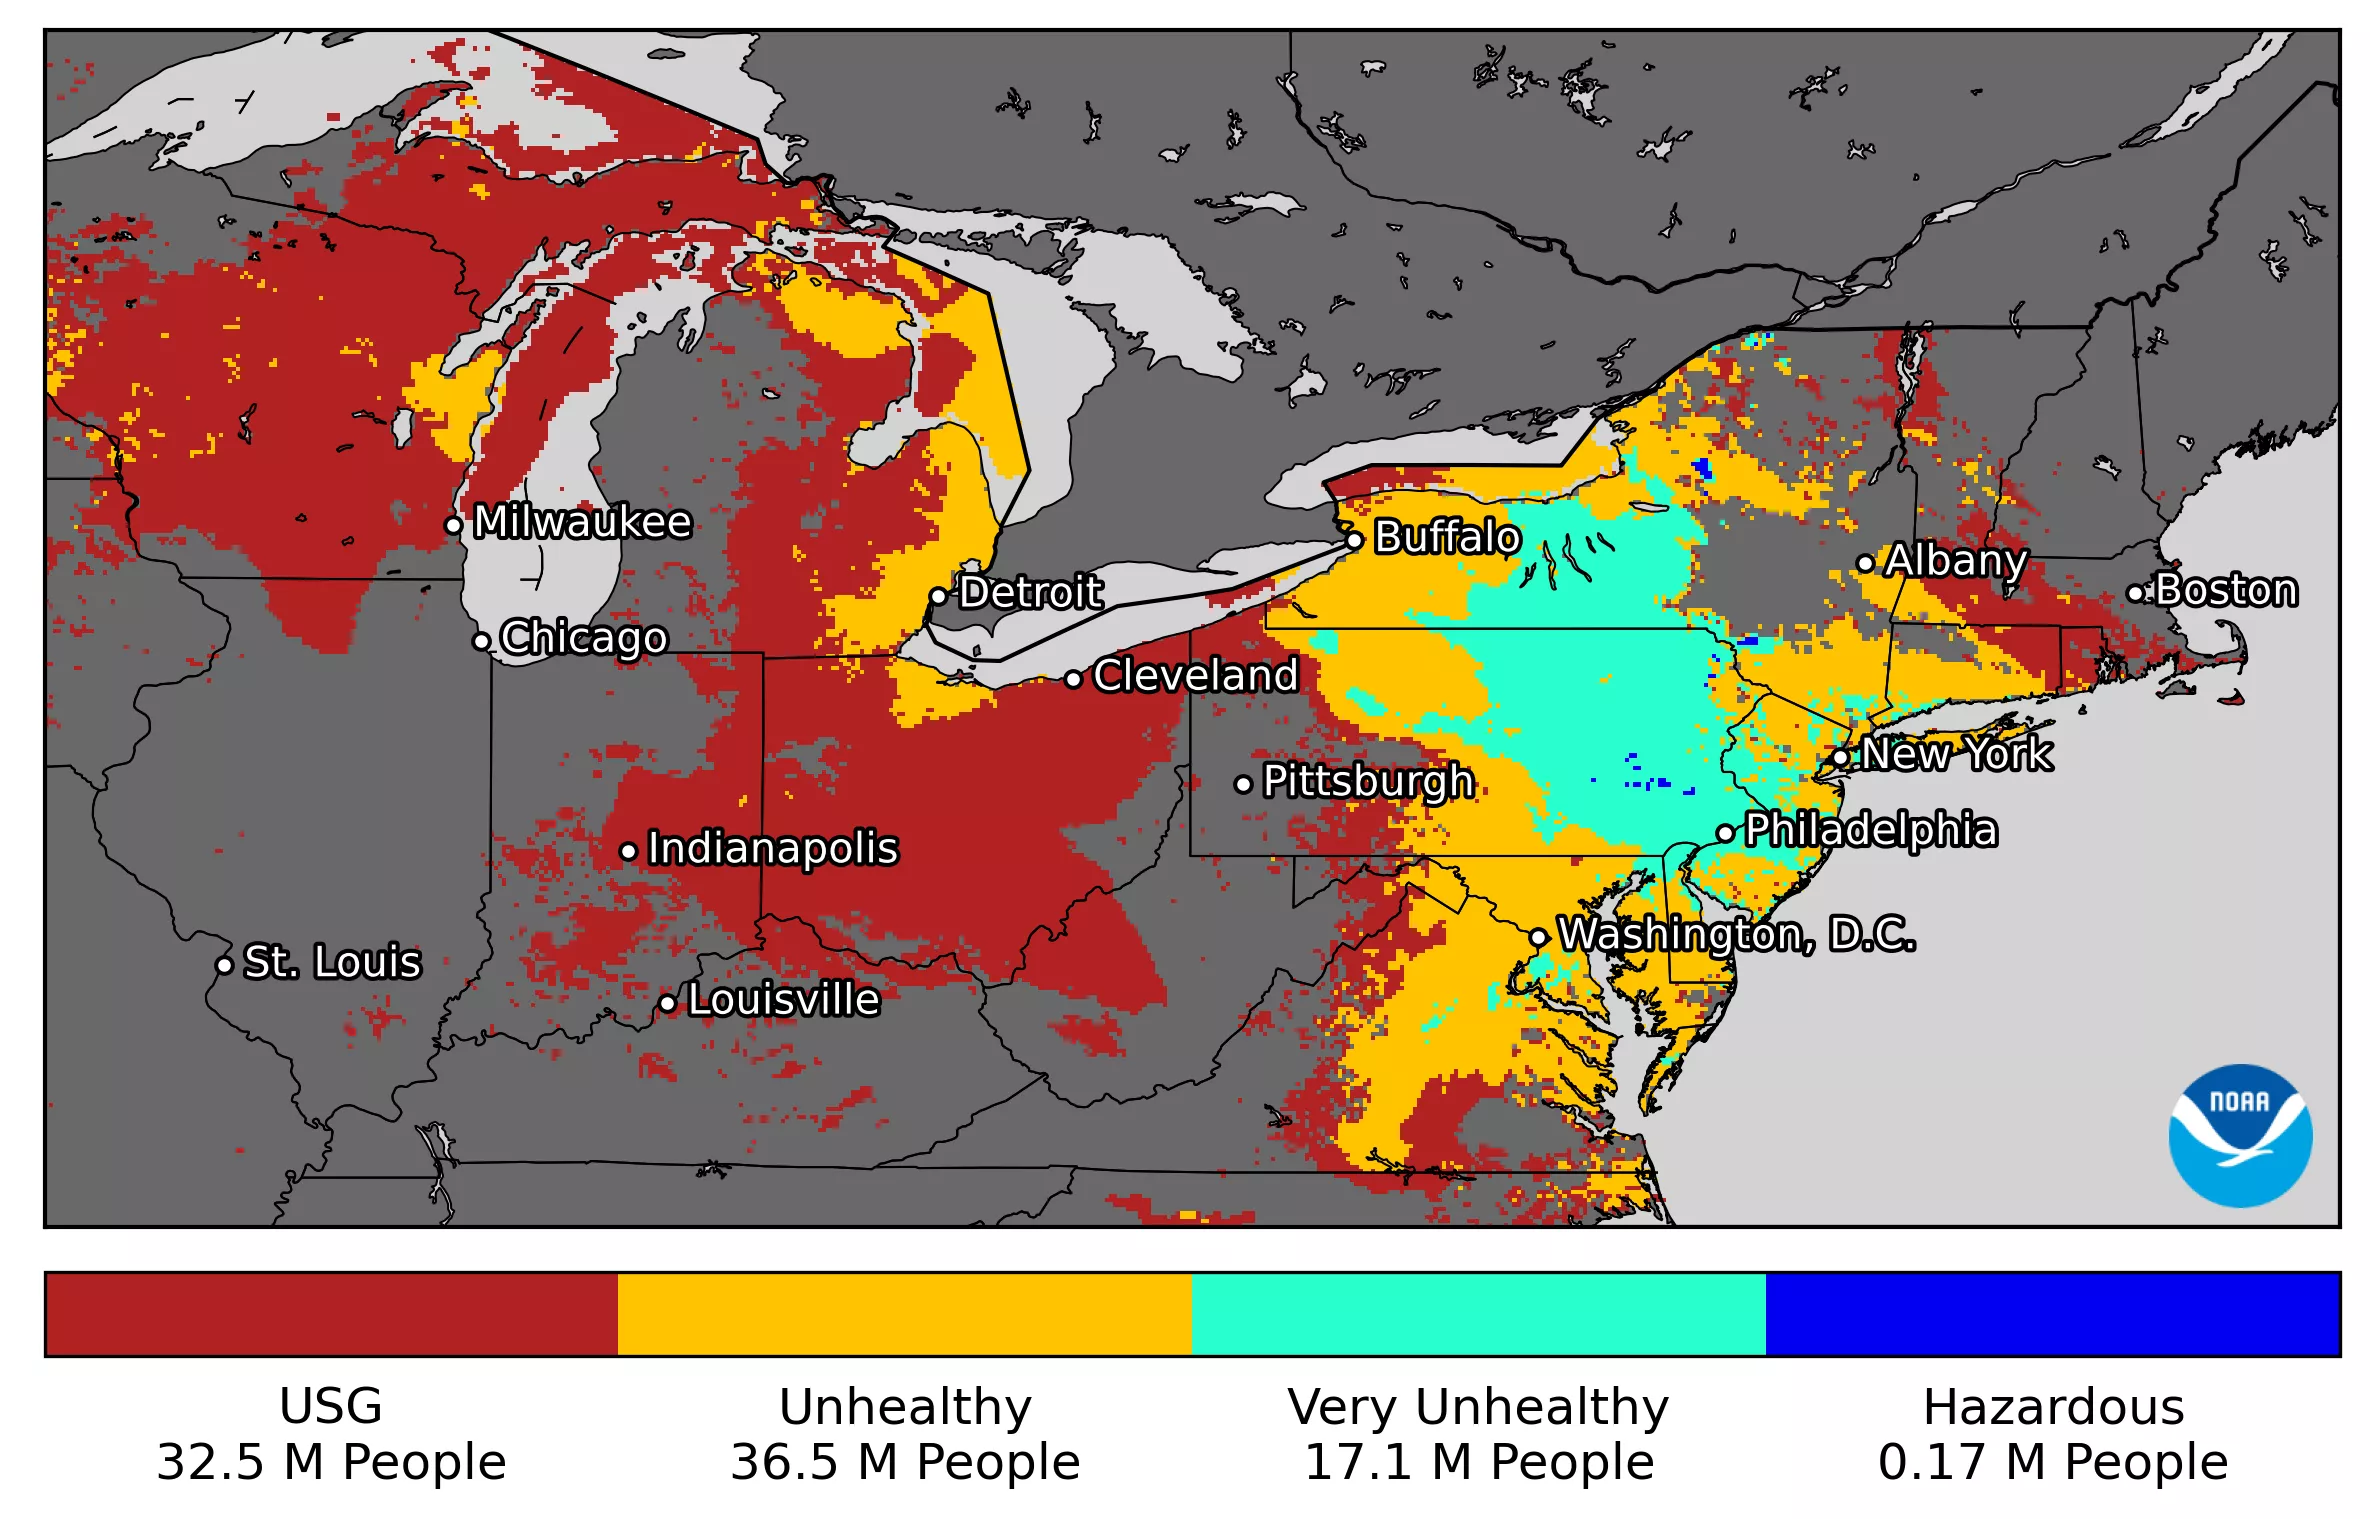
The wildfire smoke had a stunning impact on human exposure to harmful air quality, according to estimates from NOAA’s Visible Infrared Imaging Radiometer Suite sensor on the NOAA-20 and Suomi NPP satellites. The designated colored areas in the figure below include more than 17 million people in major cities such as New York City, Philadelphia, and Washington, D.C, who were breathing “Very Unhealthy” air.
“The smoke is a mixture of very small particles and gases that can cause a variety of heart and lung problems when breathed in, and the satellite-based information on air pollution levels helps people avoid exposure to these harmful pollutants,” said Susan Anenberg, Professor and Chair of the Environmental and Occupational Health department at George Washington University.
Collecting smoke observations daily and creating a long-term record allows NOAA to put these events in context. “Instantaneous estimates of the number of people exposed to harmful levels of smoke are only possible because of near real-time processing of NOAA satellite data,” Kondragunta said. “This information is critical for issuing timely air quality alerts and reducing people’s exposure to harmful smoke.”


