
From March 14-16, 2025, NOAA satellites closely monitored a powerful storm system that tore through the central and eastern United States, unleashing a devastating mix of severe thunderstorms and tornadoes, destructive winds, dust storms, and wildfires in its wake. The system left a path of destruction from the Mid-Mississippi River Valley to the Gulf Coast, and up through parts of the Mid-Atlantic and Northeast. During this three-day event, Missouri, Arkansas, Mississippi and Alabama were hit most heavily by thunderstorm hazards.
To monitor these storms, NOAA relied on its fleet of geostationary and polar orbiting satellites.
The Geostationary Operational Environmental Satellites (GOES) provided near real-time imagery of the atmospheric conditions during the event, while the Joint Polar Satellite System (JPSS) satellites worked in collaboration to deliver high-resolution observations that fed numerical weather models, which produced forecasts three to seven days in advance. Together, these advanced satellites helped equip forecasters and local authorities with critical information needed to protect lives and property.
Learn more about how NOAA satellites help us stay ahead of severe weather.
The following satellite images highlight key aspects of the storm system, including severe thunderstorms, wildfires and dust storms.
Severe Thunderstorms and Tornadoes in the South
Throughout these three days, more than 100 tornadoes touched down across multiple states, some with winds more than 190 mph. One of the strongest storms, an EF-4 in Diaz, Arkansas, had peak winds of 190 mph and stayed on the ground for nearly 19 miles. Another EF-4 in Walthall County, Mississippi, traveled over 35 miles with winds reaching 170 mph.
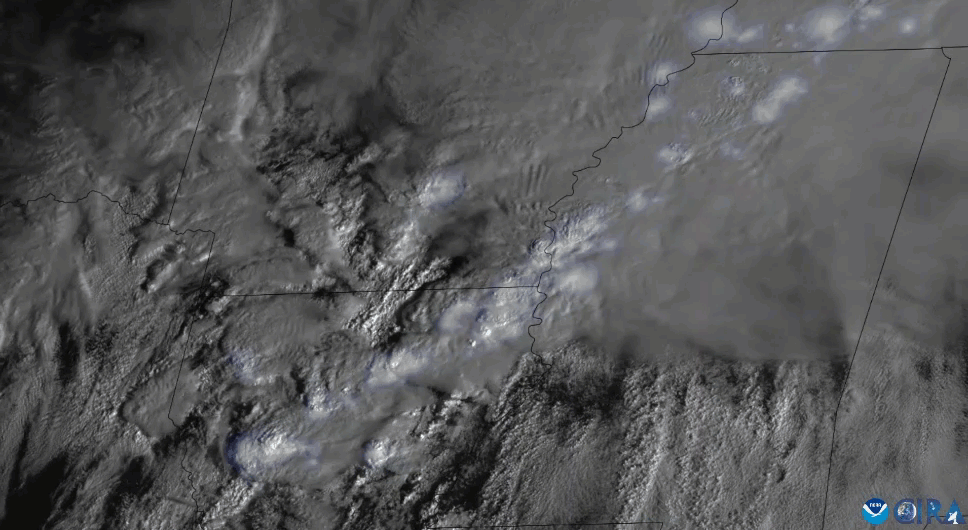
Various types of imagery via the GOES East (GOES-16) satellite’s Advanced Baseline Imager (ABI) helped meteorologists and forecasters track the storms as they progressed, and showed them details about cloud properties and atmospheric conditions such as overshooting tops, gravity waves and above-anvil cirrus plumes (AACP)—indicators of a storm’s severity—in near real-time.
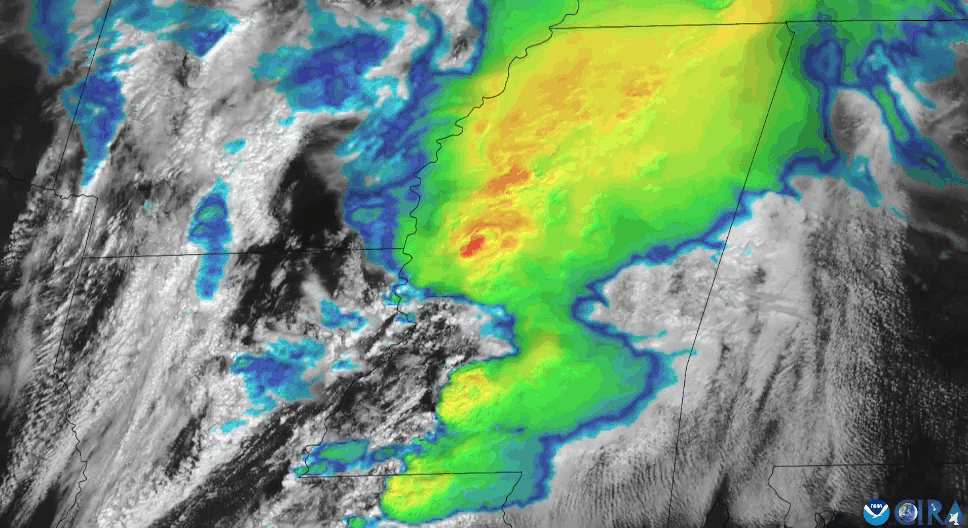
Imagery via NOAA’s GOES East satellite shows dangerous thunderstorms in Mississippi that spawned numerous tornadoes across the region on March 15, 2025. This imagery combines infrared band 13, visible band 2.
Multi-day GeoColor imagery via NOAA’s GOES East satellite follows the severe weather outbreak that occurred across the central and eastern United States. This imagery spans from March 14-17, 2025.
Each GOES satellite also carries a Geostationary Lightning Mapper (GLM) instrument that continuously monitored lightning activity throughout this event. By identifying rapid increases in lightning activity, which is indicative of a strengthening storm, the GLM helped forecasters provide earlier warnings to the public.
NOAA’s GOES East, watched severe and tornadic storms erupt across the southern United States on March 14, 2025, along with frequent lightning flashes. Imagery combines visible band 2/GLM Group Energy Density.
NOAA’s GOES East watched severe and tornadic storms erupt across the southern United States on March 15, 2025, along with frequent lightning. Imagery combines visible band 2/GLM Group Energy Density.
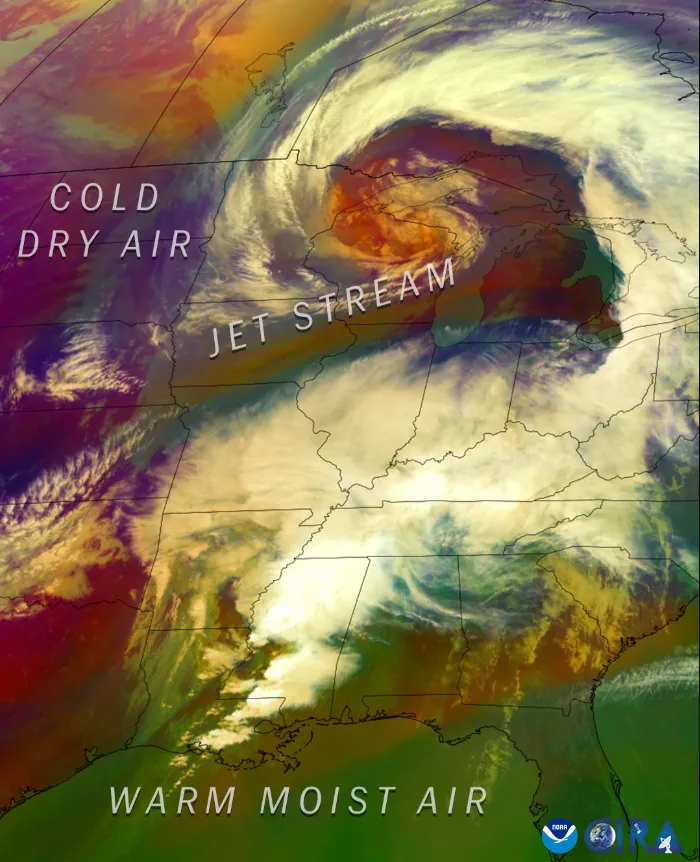
Air Mass imagery from GOES East on March 15, 2025, helped show the clash of air masses and the powerful jet stream fueling the system.
Scientists also used a machine-learning model called ProbSevere in addition to a companion AI tool called LightningCast to make predictions about the storm.
ProbSevere utilizes data from the GOES satellites, as well as numerical weather prediction, National Weather Service radar and ground-based lightning data to estimate the probability that a developing thunderstorm will produce severe weather up to 90 minutes in the future. This model has been shown to add 14 minutes of additional lead-time compared to traditional radar-only methods.
LightningCast predicts where lightning is likely to occur, often before precipitation forms, which in this case, gave people critical advance notice to seek shelter. It also can help identify lingering lightning threats in storms with intermittent activity and helps assess when the danger is diminishing. By detecting clear predictive signals ahead of weather radar, LightningCast helped to forecast lightning up to 60 minutes before the first observed flash.
One particular example during this event where both ProbSevere and LightningCast were helpful for forecasters was in predicting the intensity of thunderstorms that hit Tylerown in south-central Mississippi. This town was hit twice by tornadic supercells during the span of 40 minutes, causing devastating damage. The first supercell even went on to produce more major tornadoes as far as 200 miles away in western Alabama. LightningCast was also able to provide roughly 15 to 30 minutes of lead time before lightning began.
To learn more about how ProbSevere and LightningCast were used for this storm system, check out the CIMSS Satellite Blog.
For more examples of how NOAA satellite imagery was used to track the severe thunderstorms during this extreme weather event, please visit the Satellite Liaison Blog.
Wildfires Rage Across the Plains
Extreme winds helped fuel dozens of wildfires, scorching more than 100,000 acres across Kansas, Nebraska, Oklahoma, Missouri and Texas. In Oklahoma alone, 300 structures were damaged or destroyed. Some of the most destructive fires occurred in Oklahoma and included the 33 Road Fire, the 840 Road Fire and Big Eagle Fire.
Forecasters from the National Weather Service (NWS) rely on GOES satellite imagery during active fire operations to detect new wildfires and monitor their progression in real time. For example, NWS Tulsa, OK used satellite imagery to detect fires early in the event, stating “An historic fire weather and high wind day is in progress across northeast Oklahoma, with multiple 60 to 70 mph gusts recorded in the past 1 to 2 hours, considerable blowing dust and the beginnings of multiple fires visible on both satellite and area radars.”
Additionally, Oklahoma Forestry Services used thermal signals to model the spread of the fires and assess if they posed an imminent threat to life and property. In all, officials in Oklahoma issued 27 Fire Warnings based on this information.
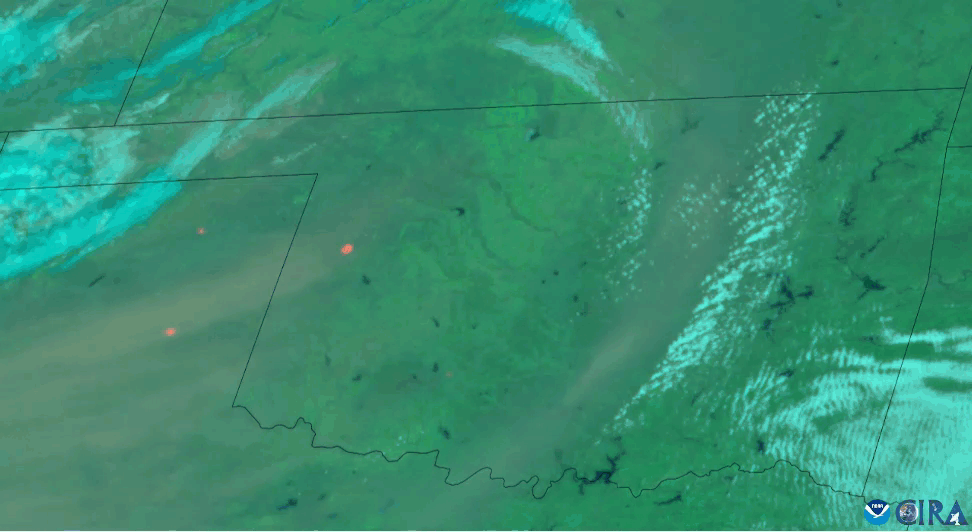
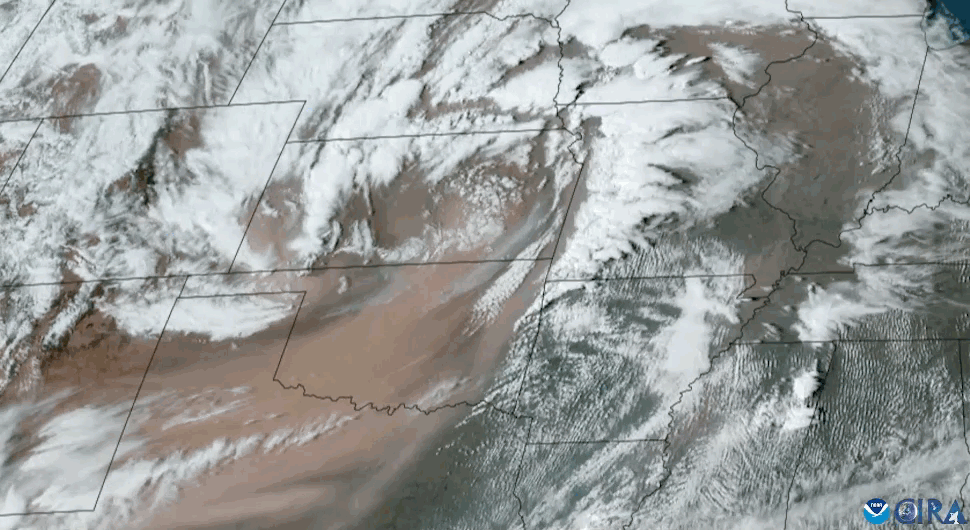
NOAA’s GOES East satellite monitored an outbreak of dangerous wildfires in Oklahoma and Texas on March 14, 2025, some of which prompted immediate evacuations. This type of imagery shows the heat signatures and smoke plumes from these blazes, along with some blowing dust from the west.
NOAA’s JPSS satellites (NOAA-20, NOAA-21, and NOAA/NASA Suomi-NPP, ) collected imagery of a dust storm sweeping across the southern Plains as numerous wildfires popped up across Texas and Oklahoma on March 14, 2025. This imagery shows the heat signatures and smoke plumes from these fires, along with dust blowing from the west.
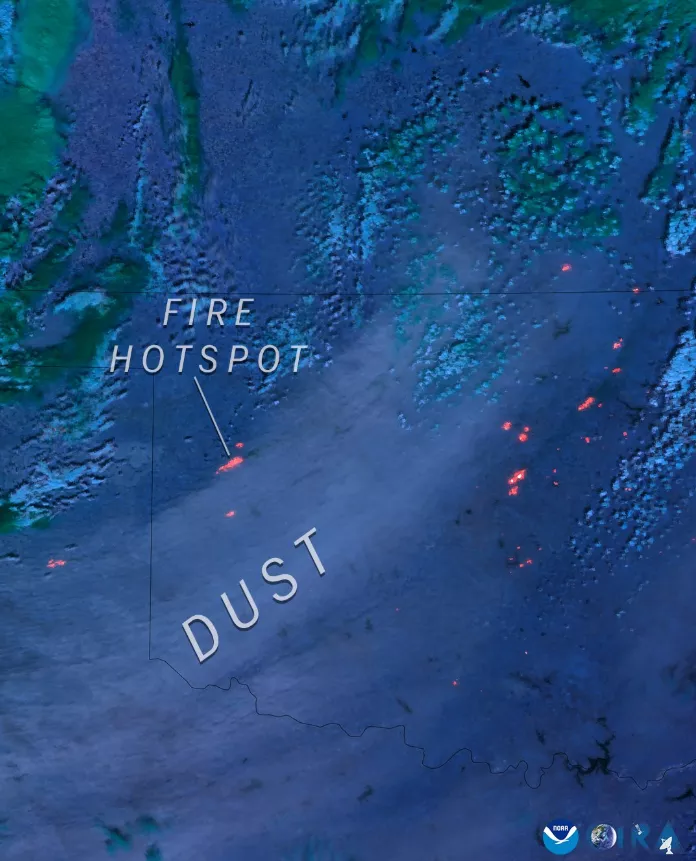
On March 14, 2025, the NOAA-21 satellite detected hotspots from fires in Texas, Oklahoma, and Kansas.
For more examples of how satellite data helped us track wildfires during this severe weather event, please visit the Satellite Liaison Blog.
High Winds and Blowing Dust
The system also brought severe, often hurricane-force winds that created blinding dust storms in some areas that led to multiple interstate closures and major traffic accidents. A few examples include a 70-vehicle pileup that shut down I-70 for over 24 hours in Kansas; an eight-car crash that closed I-44 near the Oklahoma-Texas border; and numerous semi-trucks that were flipped over on highways throughout Texas, Oklahoma, and New Mexico. Some of the strongest recorded wind gusts included 95 mph in Organ, N.M.; Pine Springs, Texas; and Frederick, Okla.
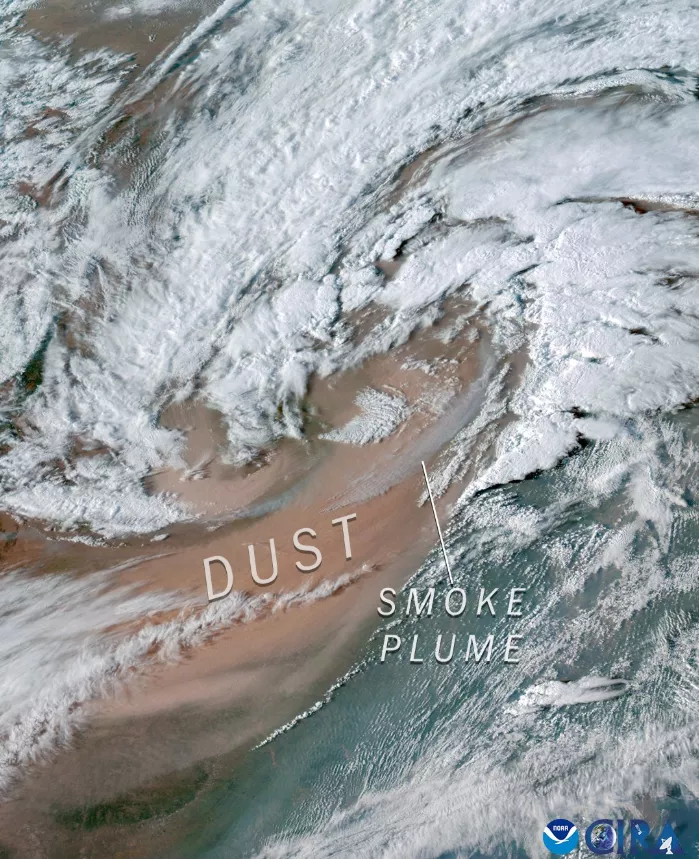
Based on a combination of satellite and ground observations, NWS offices across the central and southern Plains issued zone-based blowing dust advisories and warnings. The satellite imagery helped define the aerial extent of blowing dust and shape the warning boundaries.
Additionally, a new experimental tool developed by NOAA’s Center for Satellite Applications and Research (STAR) was used during this event to detect atmospheric aerosols. This tool combines data from the GOES ABI and NASA’s Tropospheric Emissions: Monitoring of Pollution (TEMPO) mission. The TEMPO-ABI hybrid algorithm provides hourly daytime observations of smoke and dust, making it easier to distinguish between the two. This distinction proved especially useful when both smoke and dust were present in the atmosphere, severely reducing visibility and degrading air quality. By integrating data from multiple sources, this algorithm helps scientists and forecasters better characterize the timing, location and concentration of airborne particles.
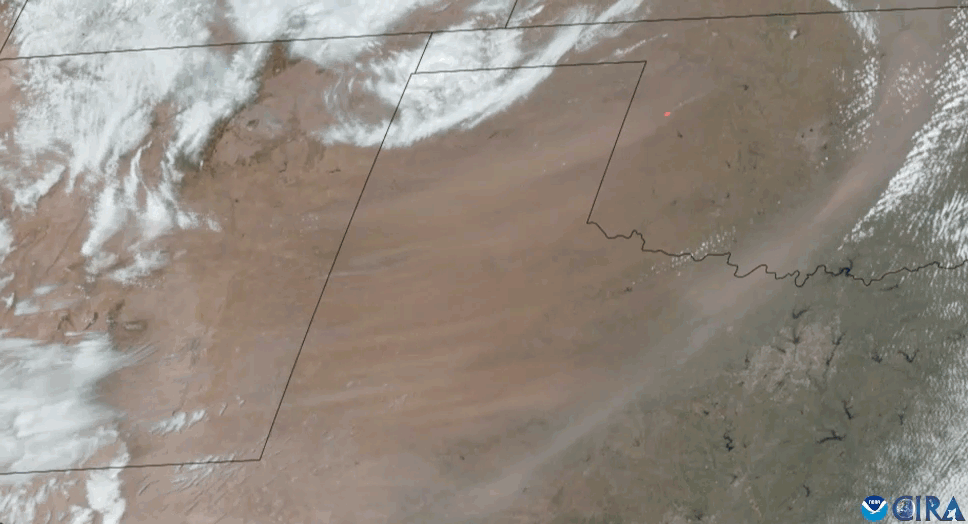
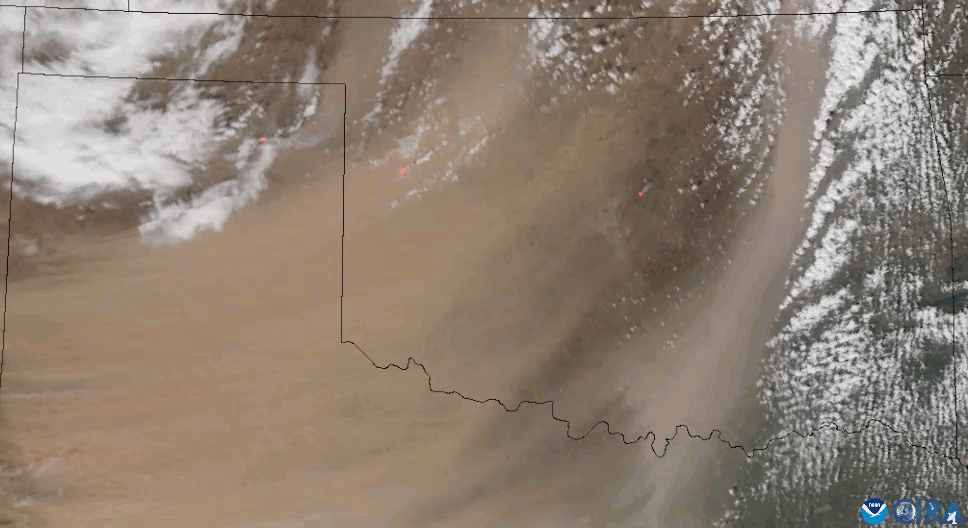
NOAA’s GOES East satellite monitored large swaths of blowing dust over Texas and Oklahoma, due to strong, damaging winds sweeping across the southern Plains on March 14, 2025. Some heat signatures and smoke plumes from fires can also be seen in northern Texas and Oklahoma.
On March 14, 2025, damaging wind gusts up to over 80 mph kicked up large amounts of dust across the plains, greatly reducing visibility. NOAA’s GOES East tracked this dust as well as smoke plumes from wildfires.
For more examples of how satellite data helped us track wildfires during this severe weather event, please visit the Satellite Liaison Blog.
As survey teams continue to assess the damage, the true toll of this extreme weather outbreak is still unfolding. Communities affected by tornadoes, wildfire and dust storms are only just beginning the long road to recovery.
If you are in an area prone to severe weather, be sure to stay prepared and informed.
To download imagery from above, please visit the CIRA Satellite Library.