August 12, 2020

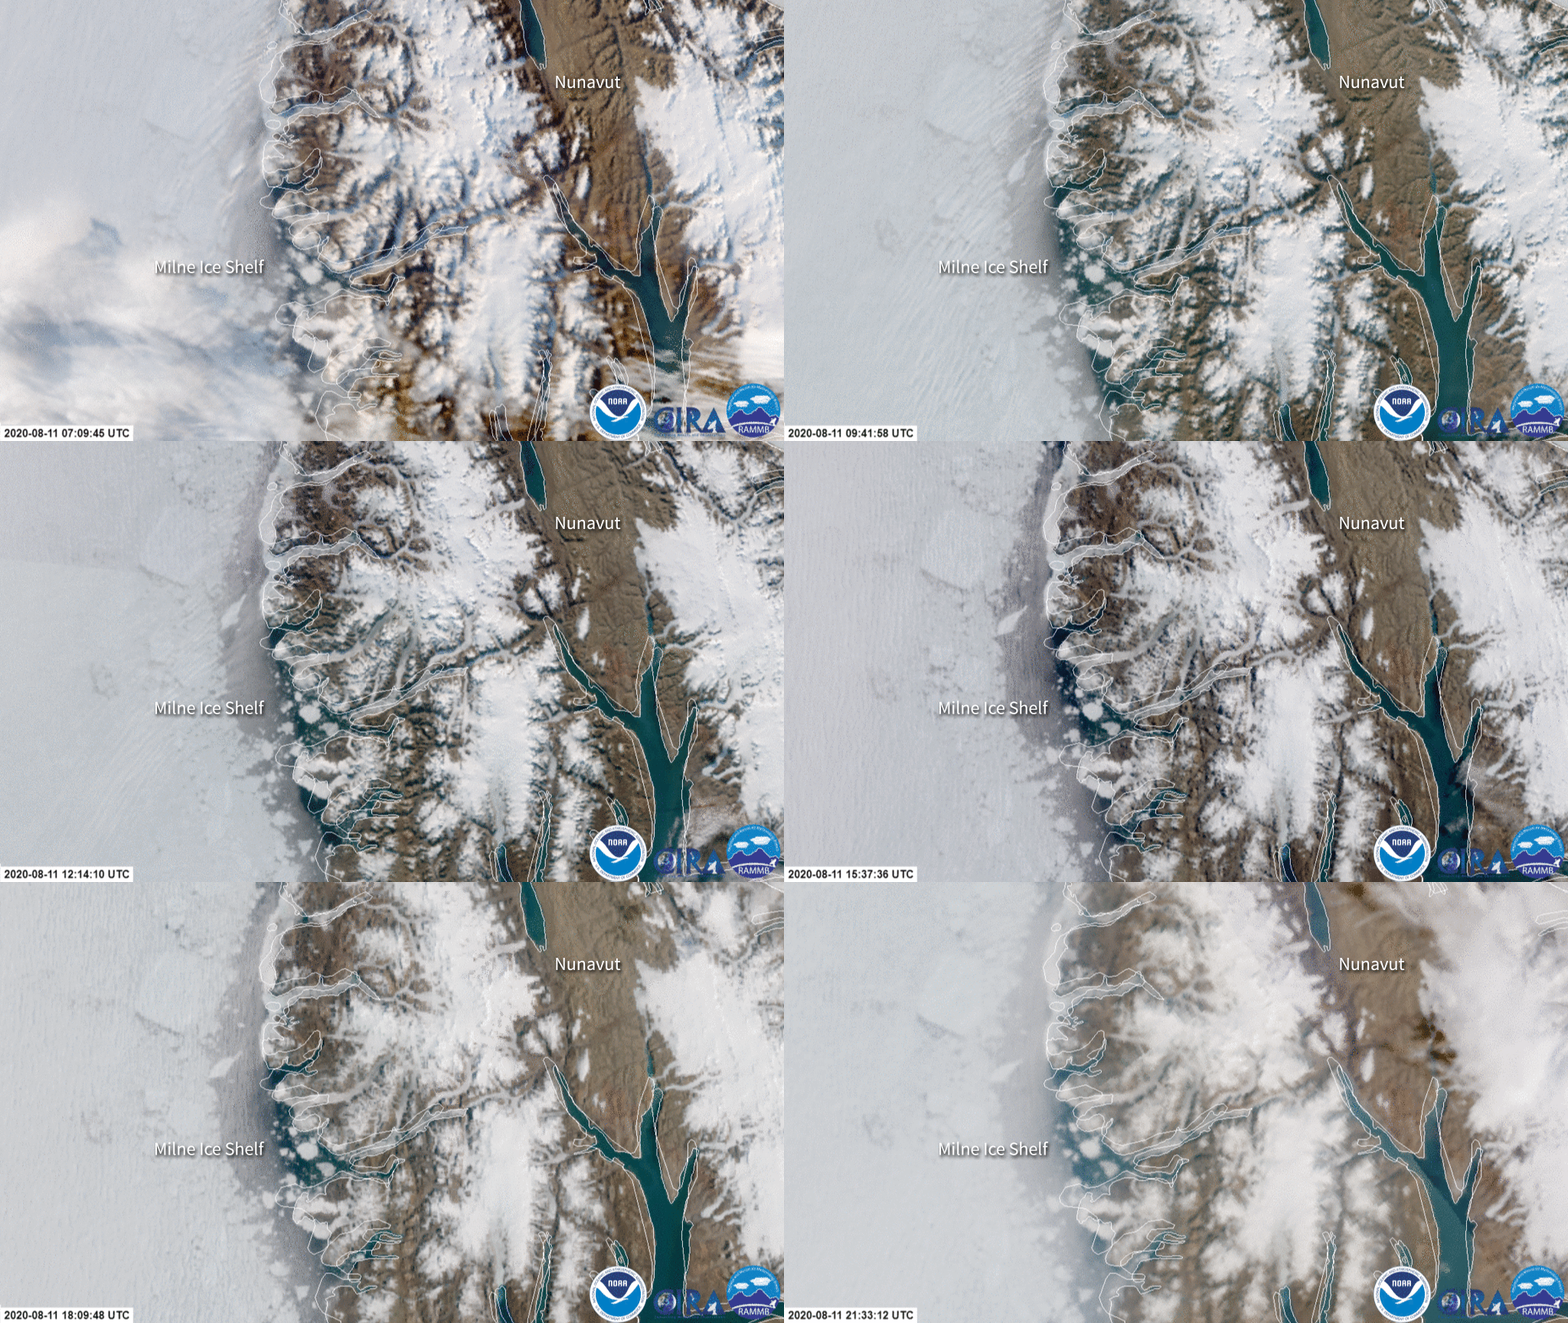
Between July 30 and August 4, the Milne Ice Shelf collapsed into the Arctic Ocean. As Canada’s last fully intact ice shelf , it was estimated to have shrunk the remaining mass by 43 percent, losing more than 30 square miles of land area, which is bigger than the size of Manhattan. The JPSS imagery above shows smaller icebergs, or bergy water , that are floating by the coastline from August 11-12.
Located in Canada’s largest and northernmost territory, Nunavut, the shelf is thought to have collapsed mostly because of above-normal temperatures for the region during July 2020, 9 degrees Fahrenheit warmer than the established 30-year average. The Canadian Ice Service (CIS) also added that “off-shore winds and open water in front of the ice shelf are all part of the recipe for ice shelf break-up.”
The European Space Agency’s (ESA)Sentinel-1 satellite - part of their Copernicus Earth Observation program - captured imagery of the ice breakage using the onboard synthetic aperture radar (SAR) sensor to see through the area’s heavy cloud cover.

Additionally, imagery from USNIC and JPSS shows exactly where the iceberg disconnected from the shelf’s larger mass. The yellow lines denote the original edge of the shelf on July 30; on August 11, when the second image was taken, one can clearly see the large gap the breakage left.


From July 30-31, sources from Carleton University say that the breakage created one large ice island, which later split into two pieces (measuring at 21 square miles and 9 square miles respectively) along with smaller icebergs by August 3. Additionally, they mention that due to the Milne Ice Shelf being thicker than the others, the new ice islands are about 260 feet thick. The CIS will continue to monitor the icebergs for navigational hazards to oil rigs and ships.
The article's main image was captured by the JPSS satellites’ VIIRS instrument , which scans the entire Earth twice per day at a 750-meter resolution. Multiple visible and infrared channels allow it to detect atmospheric aerosols, such as dust, smoke, and haze associated with industrial pollution and fires. The polar-orbiting satellite circles the globe 14 times daily and captures a complete daytime view of our planet once every 24 hours. Images taken by the VIIRS sensor during each orbit are then merged together to create image mosaics of larger regions, like the one used here.
The data from Sentinel is made available to NOAA through a partnership with the European Commission’s Copernicus Programme. In addition to detecting ice, the synthetic aperture radar (SAR) sensor on Sentinel-1 is used for measuring surface winds and detecting oil spills.
