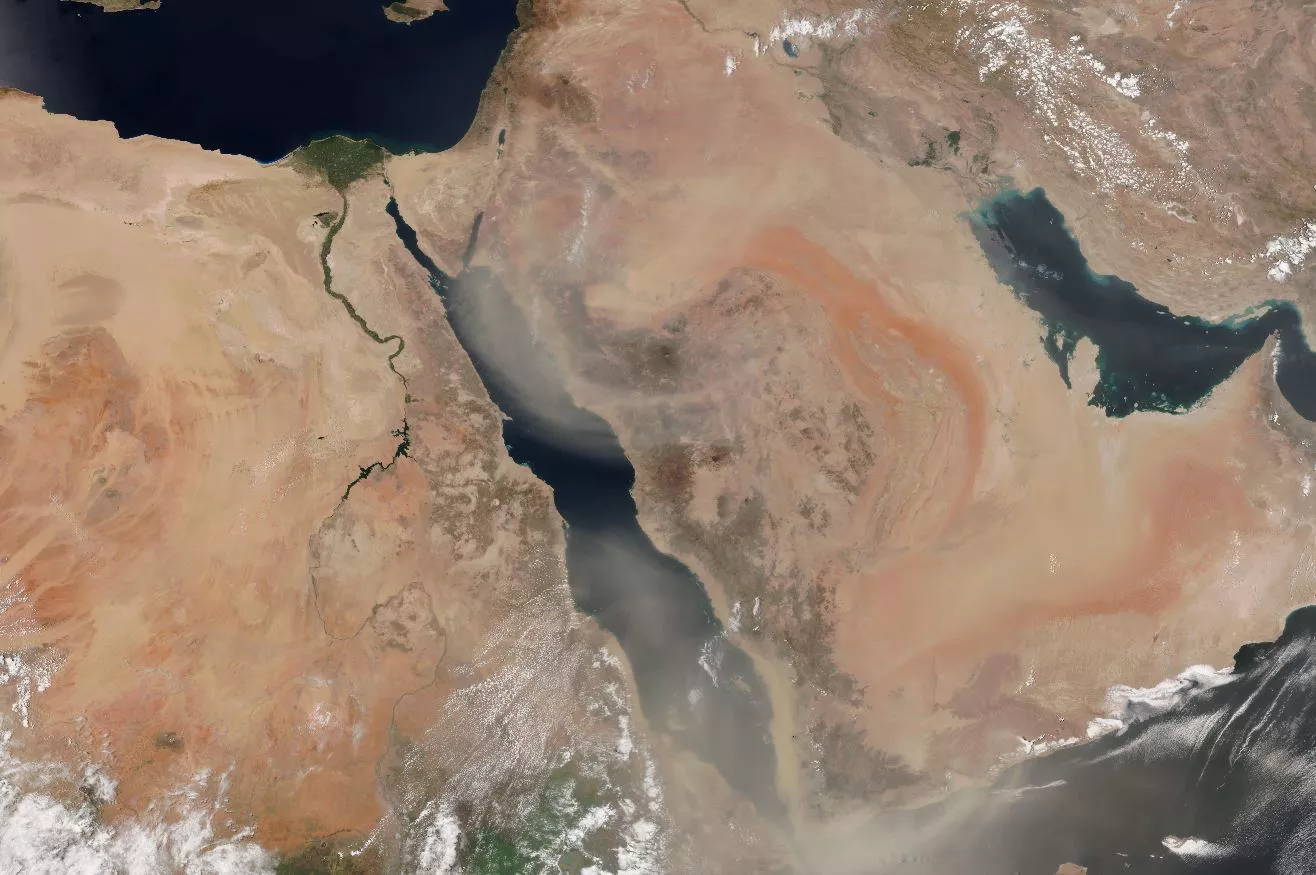
It's dusty out there. Beyond the research indicating the frequency of dust storms is on the rise around the world, scientists estimate that, on average, about 20 teragrams of dust are suspended in the atmosphere at any given time!

According to new NOAA-led research appearing in the journal Geophysical Research Letters, the number of dust storms in the southwestern United States is increasing. Scientists say the region's average of 20 dust storms per year in the 1990s has jumped to 48 per year in the 2000s.
Fortunately, GOES-16 is on the job to help us spot them! The following animation from GOES-16 shows a large plume of dust from the desert southwest being dragged eastward, across northwestern Texas and east Oklahoma, by a front moving over the high plains in the early morning hours of March 24, 2017. So where is the dust in this loop? Well, it's not represented by the yellowish/brown color--that's atmospheric moisture. Rather, the dust appears as magenta or pink. The other colors denote the following: the dark blues are thin cirrus clouds, and the pale blue (on the right side of the image) indicates the surface (land and water) of the Earth.

The bright colors shown here are the result of a " dust enhancement " -- an experimental data product created by scientists at the European Organisation for the Exploitation of Meteorological Satellites (aka: EUMETSAT). Based on infrared channel data, this RGB (red-green-blue) enhancement was created to help analysts monitor the evolution of dust storms. According to EUMETSAT, monitoring of dust in the atmosphere 24 hours a day can be a challenge because the appearance of dust in satellite imagery changes drastically from day to night.
Beyond the Southwest
According to research from the United Nations, the frequency of dust storms is also said to be increasing in other parts of the world as well, including in the vicinity of the Sahara Desert.
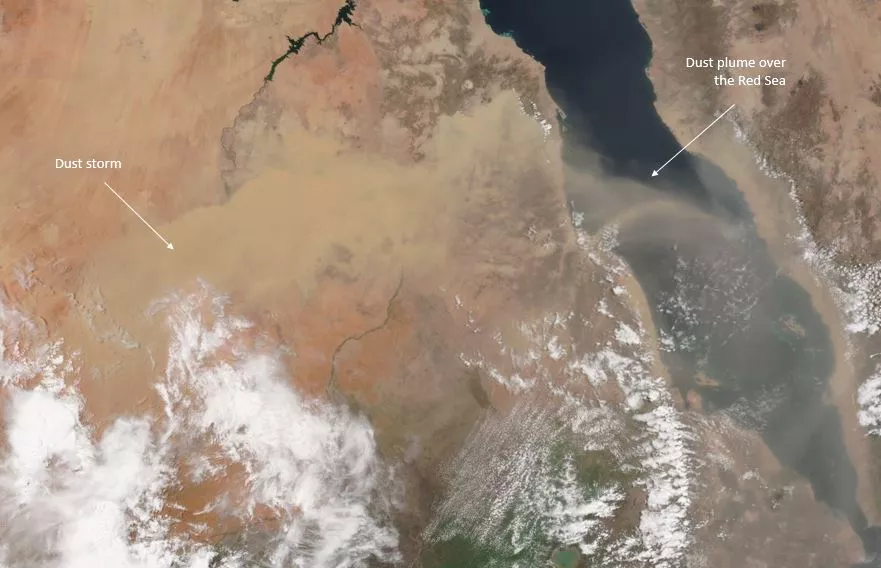
GOES-16 can't see this part of the world from its position in space, but NOAA's polar-orbiting spacecraft, such as the NOAA/NASA Suomi NPP satellite can. Suomi NPP's Visible Infrared Imaging Radiometer Suite (VIIRS) instrument captured this true-color image on July 5, 2017, showing particles from a large dust storm in the vicinity of the Egyptian-Sudanese border blow out over the Red Sea.

Suomi NPP circles the Earth from pole to pole 14 times daily in the afternoon orbit—providing full global coverage twice a day. As it does, its VIIRS' 22 spectral bands capture data used to create high-resolution imagery of the Earth and the atmosphere, including visible and infrared imaging of hurricanes and detection of fires, smoke and aerosols , including dust.
Although true-color images like this may appear to be photographs of Earth, they aren't. They are created by combining data from the three color channels on the VIIRS instrument sensitive to the red, green and blue (or RGB) wavelengths of light into one composite image. In addition, data from several other channels are often also included to cancel out or correct atmospheric interference that may blur parts of the image. (To learn more about the orbits of NOAA’s satellites , watch this video!)
Dust in the Wind
Dust storms are caused by strong winds passing over the loose particles of sandy soils, causing them move over the ground and fracture, freeing smaller particles -- i.e., the dust -- that become airborne and transported by the wind. Scientists estimate that, on average, about 20 teragrams of dust are suspended in the atmosphere at any given time and, about half of it is thought to originates in North Africa, due to both the abundance of dust sources there and the region's position under the subtropical jet stream, which carries dust around the world. The rest is said to come from just a handful of other well-known dust-producing regions, including northwestern China’s Taklimakan Desert, parts of Arabia, Iran, the shore of the Caspian Sea, the Lake Eyre Basin in Australia, and the area around Utah’s Great Salt Lake.
To see more GOES-16 animations and images, visit the GOES-16 image gallery on the NESDIS website. (Note: GOES-16 data are currently experimental and under-going testing and hence should not be used operationally.)
To learn more about the effect of atmospheric dust on the Earth's weather and the various ways scientists use satellite imagery to detect it, check out “ The Dirt on Atmospheric Dust.â€
