
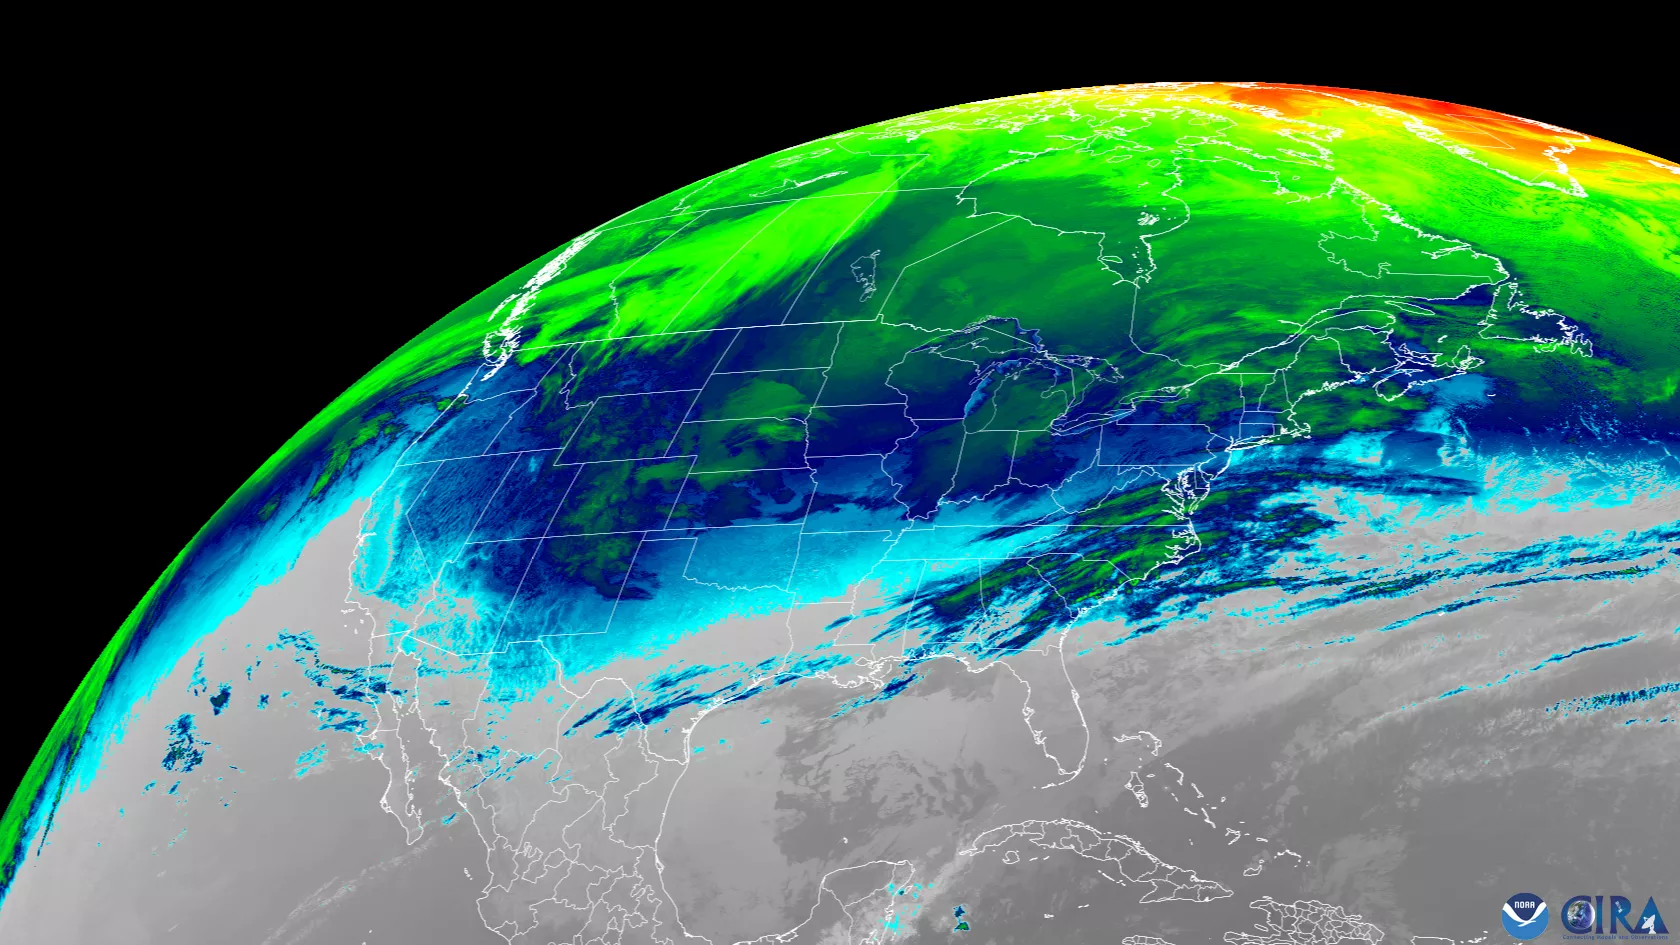
An image of North America from NOAA’s GOES-16 satellite taken on Jan. 23, 2025 [Credit: NOAA]
The imagery above, captured on Jan. 23, 2025 by the Advanced Baseline Imager (ABI) on NOAA’s GOES East (GOES-16) satellite, shows a large area of very cold air covering much of the United States and Canada—that’s the dark blue and green colors you see spread across most of the image. This indicates that temperatures at the ground are so cold they rival the frigid cloud tops seen in the image, like those along the southeastern U.S.
This imagery highlights Band 12, an infrared channel on NOAA’s GOES East satellite. The ozone band, part of the thermal infrared spectrum, allows us to track changes in the atmosphere near the tropopause with incredible detail, both day and night. This data is especially valuable for understanding turbulence and wind shear, key factors for aviation safety. Band 12 is sensitive to ozone and water vapor in the middle and upper atmosphere, making it ideal for detecting temperature differences in cold clouds and highlighting regions identifying the jet stream’s position. These insights help meteorologists determine where the jet stream dips south, drawing in colder air from Canada, and where cloud systems are setting up to release precipitation.
When the jet stream shifts southward, it can push freezing air into more southern regions, setting the stage for snow and ice in regions where they rarely occur. Meteorologists monitor these patterns in near real-time to figure out if a storm is likely to strengthen, identify areas that might receive heavy snowfall, and determine where freezing air may linger. This information equips forecasters to warn residents throughout the U.S. when to bundle up and possibly brace for snow, sleet, freezing rain, or rain.
GOES satellites are particularly valuable because they provide imagery in near real-time, giving forecasters the latest possible view. Unlike visible imagery that relies on sunlight, Band 12 and other infrared bands detect thermal (heat) signals, allowing it to operate both day and night—a critical advantage for tracking rapidly evolving weather conditions, like an overnight snowstorm.
NOAA operates two GOES satellites that work together to provide nearly continuous weather and environmental monitoring across the Western Hemisphere. GOES East, also known as GOES-16, is positioned to focus on most of North America, including the contiguous United States and Mexico, as well as Central and South America, the Caribbean, and the Atlantic Ocean to the coast of Africa. GOES West, also known as GOES-18, provides coverage over the western United States and the Pacific Ocean to New Zealand.. Together, these satellites provide overlapping coverage, allowing meteorologists to track weather systems, monitor severe storms, and observe environmental changes as they happen, ensuring timely and accurate forecasts.
By combining Band 12 with other channels, meteorologists piece together a comprehensive picture of atmospheric activity—from high-altitude storm formation to ground-level impacts. The GOES-R Series ABI views the Earth with 16 different spectral bands, including two visible channels, four near-infrared channels, and ten infrared channels. Forecasters use these different channels (wavelengths) to determine various elements on the Earth’s surface or in the atmosphere, such as trees, water, clouds, moisture or smoke. This leads to more accurate forecasts and ensures earlier warnings for the public when winter weather is on the way.