Recent findings from the International Panel on Climate Change (IPCC) predict a rise in both the frequency and intensity of local flooding, as extreme precipitation events become more common due to climate change. Flooding, the most common weather-related natural disaster, has intensified in recent decades, leading to profound losses worldwide. Since 2000 alone, global economic damages have exceeded $735 trillion and more than 130,000 flood-related fatalities have been recorded worldwide. River flooding is projected to double in impact by 2030, putting more than 132 million people at risk of displacement, disease, and food insecurity by the end of the decade. These alarming statistics highlight the need for sophisticated flood monitoring tools to help communities prepare for and adapt to the intensifying impacts of climate change, safeguarding human health, well-being, property, and infrastructure.
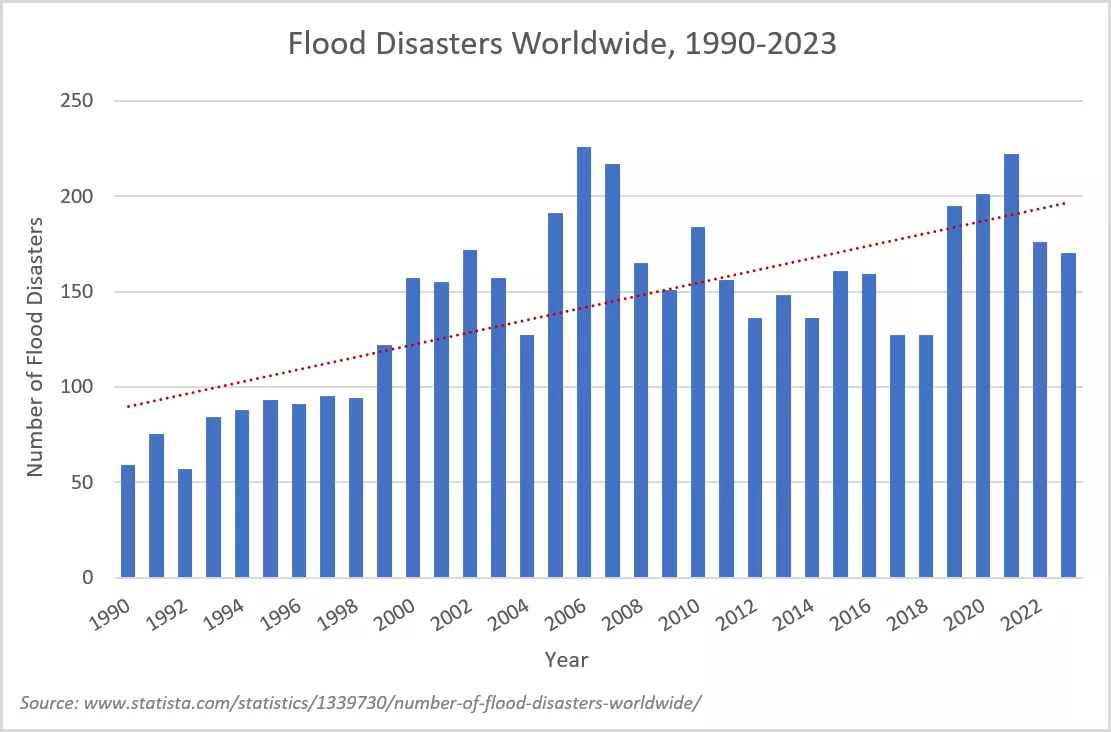
There were more than 4,800 flood disasters recorded worldwide between 1990 and 2023, with 2021 marking the second highest year within the observed period. Over the last two decades, there has been an upward trend in the frequency of flood disasters, a trend that the International Panel on Climate Change (IPCC) and other experts suggest will continue as global surface temperatures continue to rise.
Satellite-based technology has proven essential in responding to flood disasters. The NOAA Flood team, consisting of experts from the University of Wisconsin-Madison Cooperative Institute for Meteorological Satellite Studies (CIMSS) and George Mason University (GMU), has developed a suite of VIIRS Flood Products that utilize observations from the Joint Polar Satellite System (JPSS) Visible Infrared Imaging Radiometer Suite (VIIRS) to provide global near real-time visualizations of flood-affected areas. The flood products enhance situational awareness for emergency responders, weather bureaus, and affected communities worldwide.
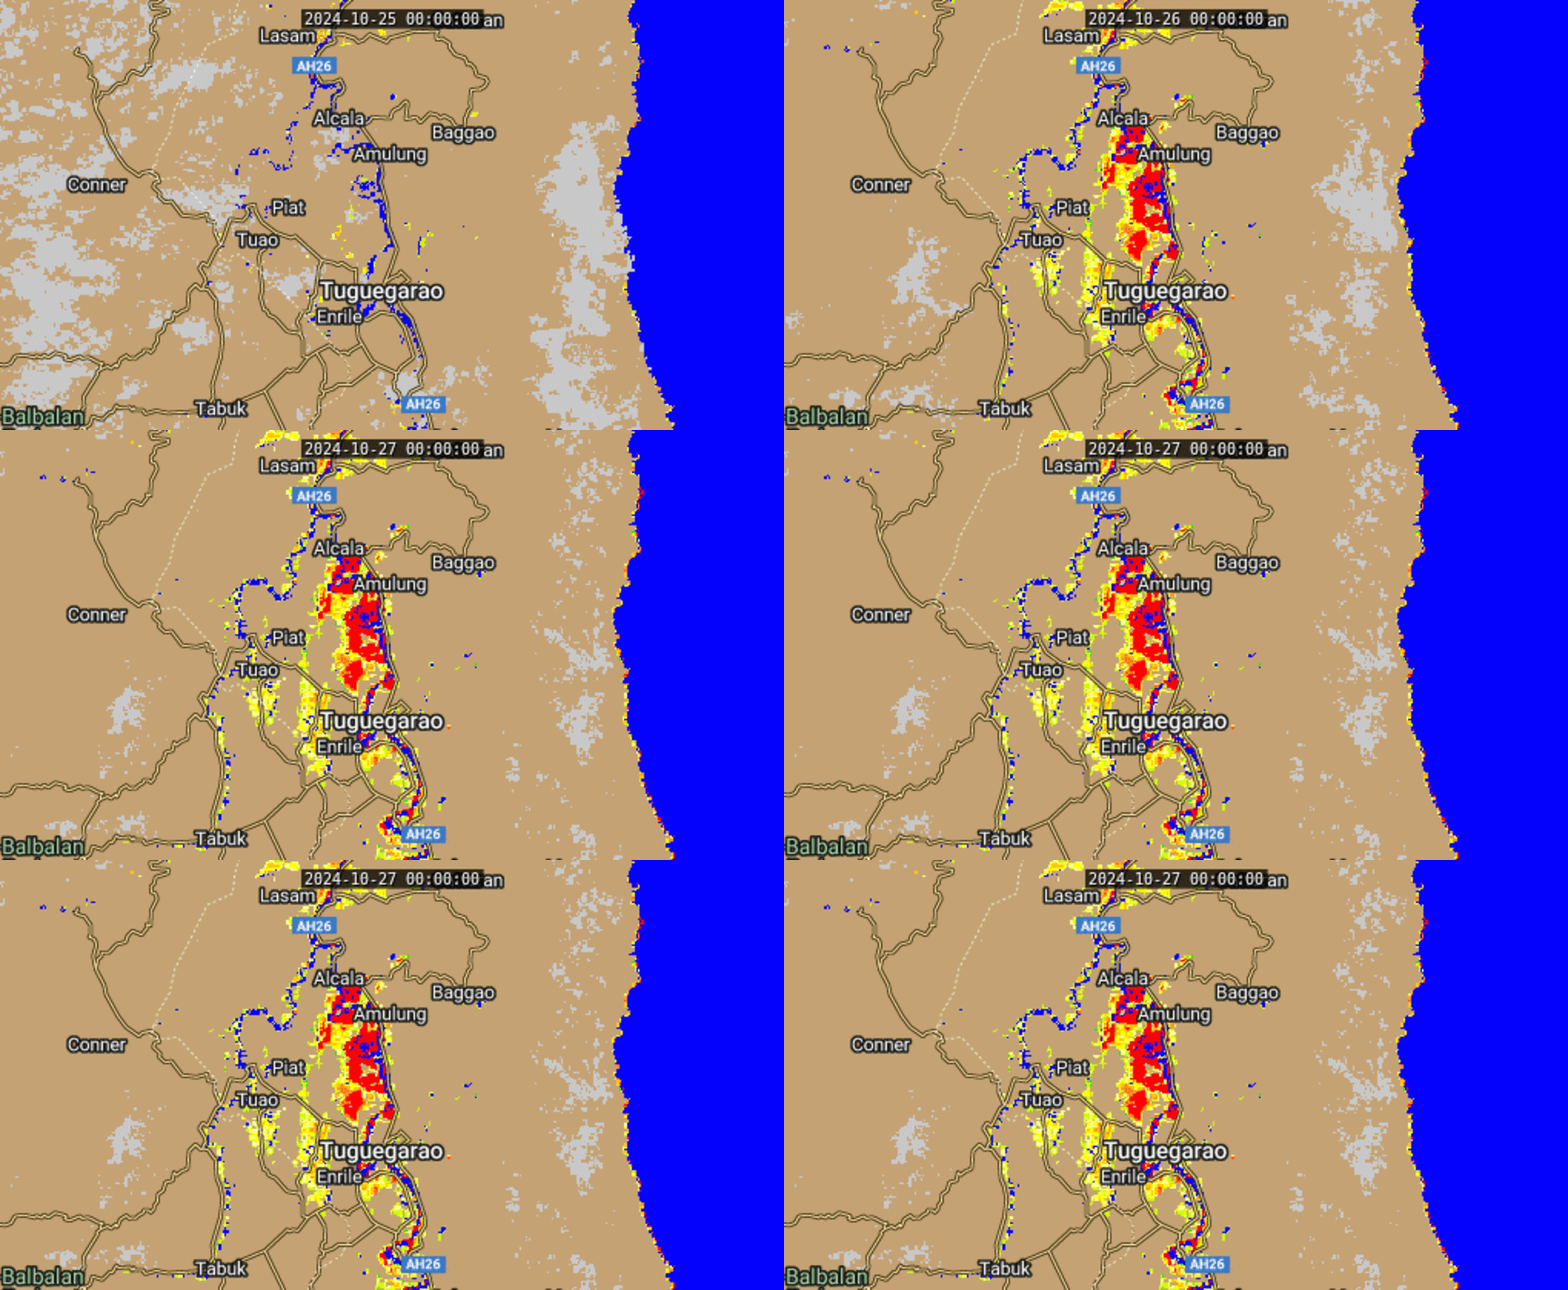
The 5-Day VIIRS River Flood Composite product from RealEarth™ shows extensive flooding near the City of Tuguegarao, Philippines on October 26 and 27, 2024. Tropical Storm Trami dumped more than a month’s worth of rain in 24 hours over large parts of the country. Higher floodwater fractions (percentages) are depicted by orange and red colors, indicating the presence of more surface water (flooding) compared to surrounding areas. Blue represents natural water bodies.
The NOAA Flood team first developed products in response to a devastating 2013 flood in Galena, Alaska, where limited monitoring left the town unprepared and underwater. JPSS satellite observations filled this gap, and VIIRS Flood Products have since evolved to include visualizations of horizontal flood extent (as seen above) and three-dimensional data on floodwater depth (as shown below), which is crucial for understanding flood severity in different terrains.
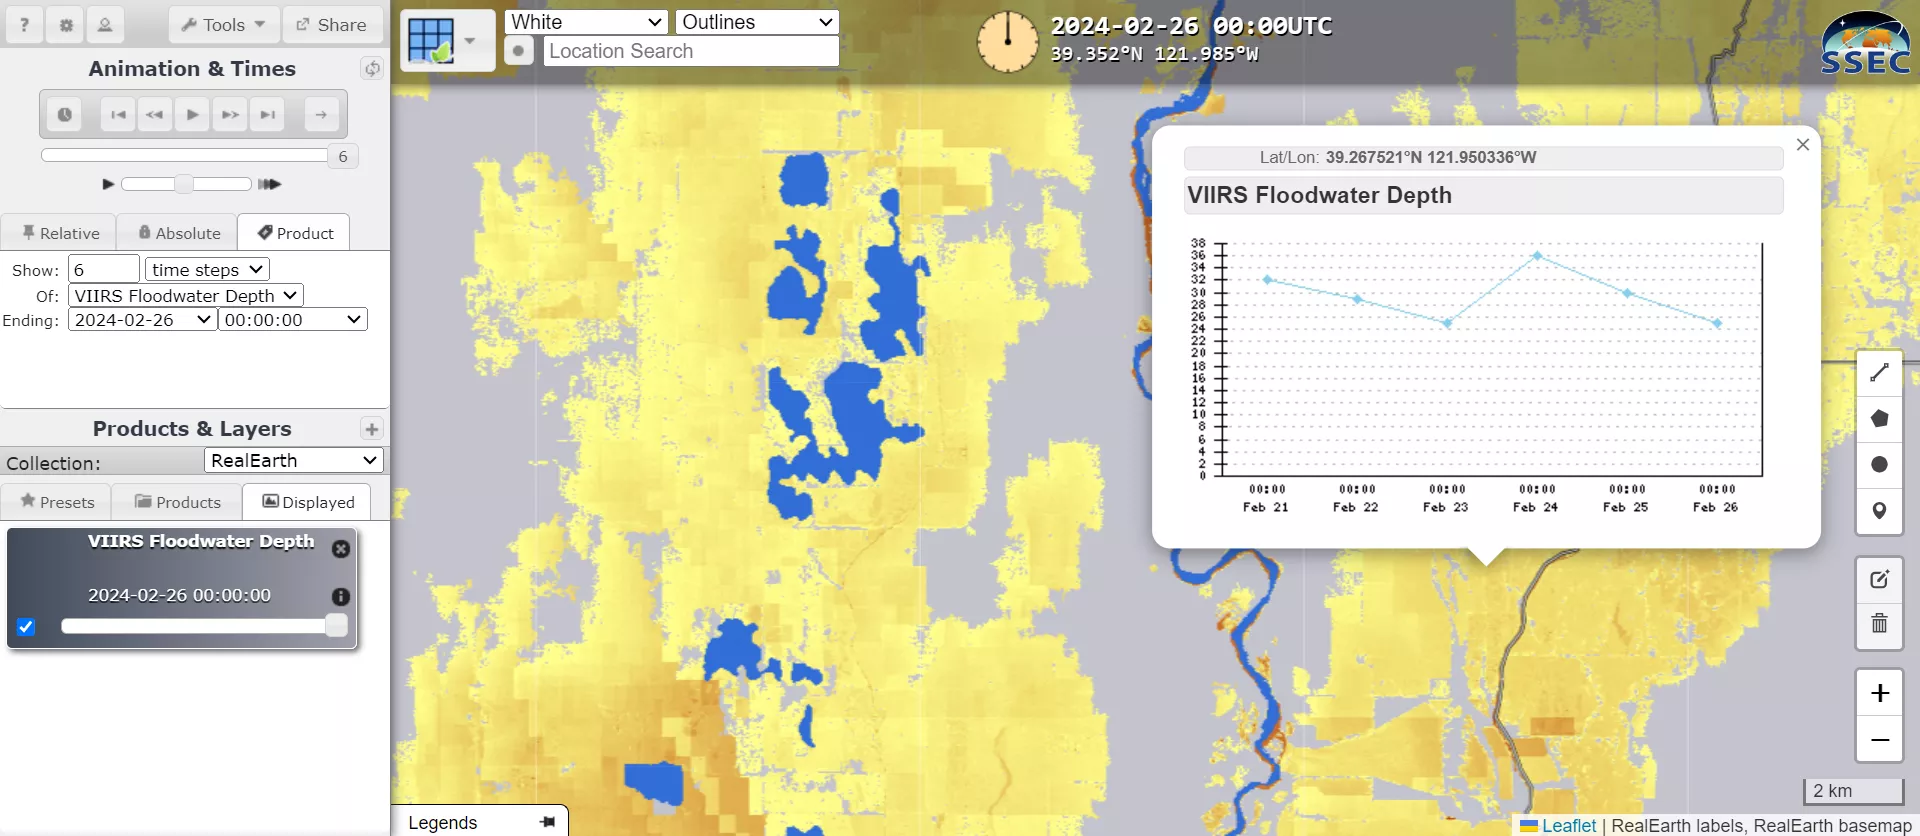
This experimental VIIRS Floodwater Depth Map from RealEarth™, displayed as a two-dimensional map, shows widespread flooding (depicted by yellow shading) in the Sacramento Valley in California on February 26, 2024, following a series of heavy storms that hit the region. By right-clicking on the map, users can generate a time series of water depth measurements for a specific location.
The Australian Bureau of Meteorology (BoM), which oversees Australia’s weather and climate services, provides a compelling example of the global application of VIIRS Flood Products. Led by Dr. Robert Pipunic, the BoM’s Observations and Assimilation/Science and Innovation Group utilizes satellite-derived flood maps where ground-based monitoring is scarce. “We are trying to exploit satellite data for flood situational awareness, impact analysis, and other things,” explains Pipunic. Leveraging VIIRS, the BoM has notably improved its response times, supporting communities at risk of supply cutoffs during severe flooding events, such as the prolonged heavy rains in Australia’s Northern Territory in late February 2024. “Using VIIRS products we can pick a region and respond,” he reiterates.
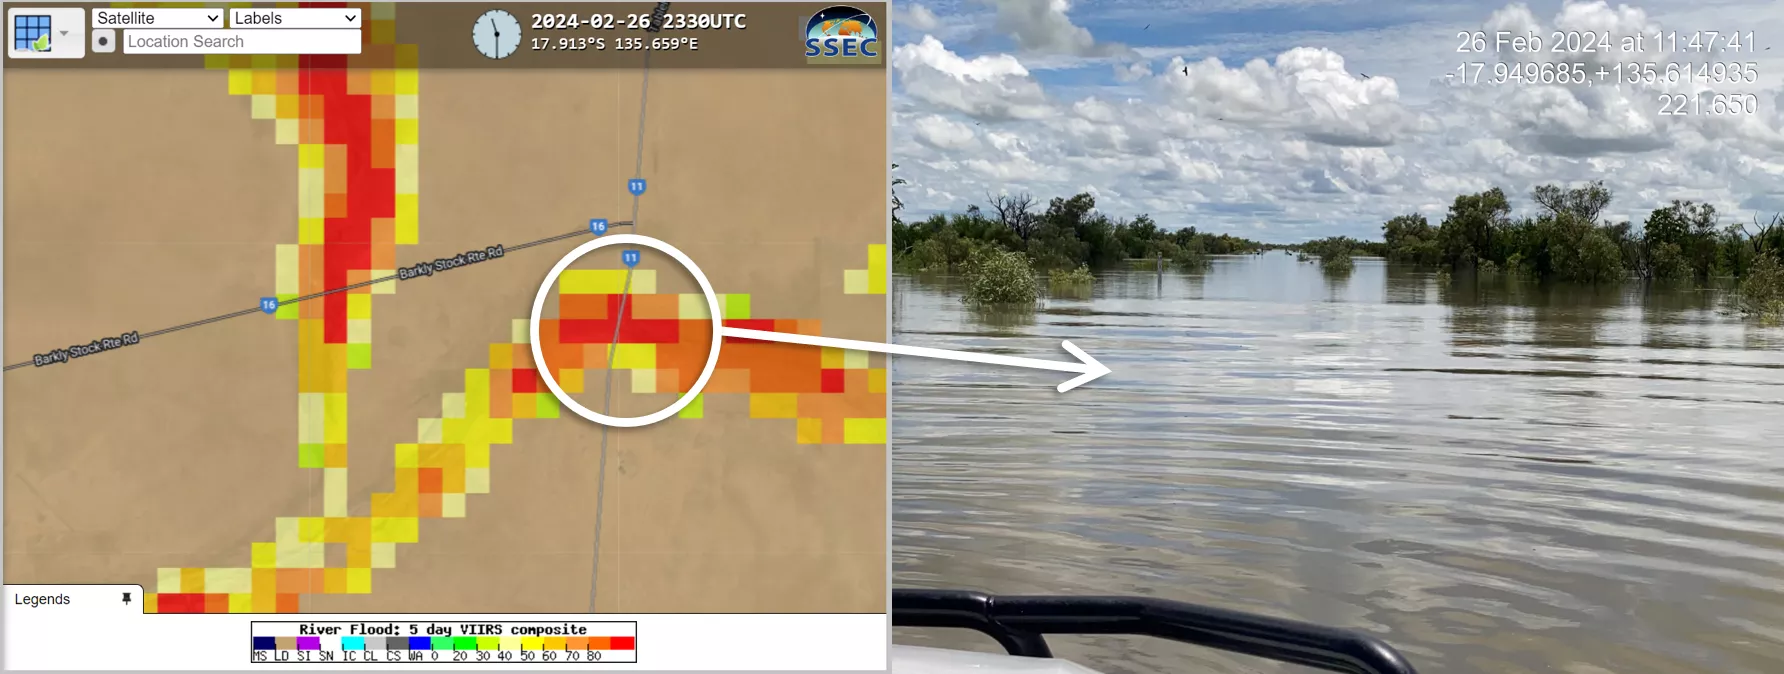
The 5-Day VIIRS Composite River Flood Map from RealEarth™ for February 26, 2024 (left) shows a portion of the Tablelands Highway in the Northern Territory—one of the most sparsely populated regions of Australia—submerged under floodwaters. To the right is an actual photograph showing the concurrent flooding situation at that specific location on the same day (photo by Road Report NT, credit: Northern Territory Government of Australia). Reports indicated that the floodwater reached heights of up to 800 millimeters above the road, leading to several consecutive days of road closures.
Along with U.S. agencies like FEMA, international organizations like the International Disasters Charter have also recognized the value of VIIRS Flood Products, using them in disaster-prone regions to improve resilience and preparedness. By providing open access to flood data through RealEarth™, the NOAA Flood team ensures that decision-makers and emergency responders worldwide can make informed choices, minimizing damage and protecting communities.
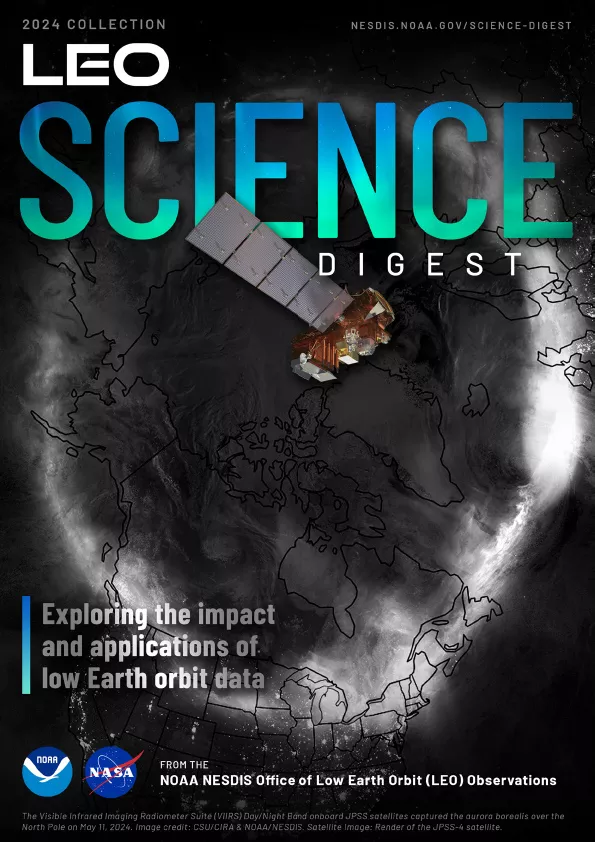
As climate change heightens flood risks, VIIRS Flood Products will play an increasingly crucial role in flood management. Stay tuned for a deeper exploration into this topic in the upcoming 2024 LEO Science Digest, published in January. In the meantime, the 2023 Science Digest offers a range of articles highlighting the diverse applications of LEO satellite data beyond flood mapping.
