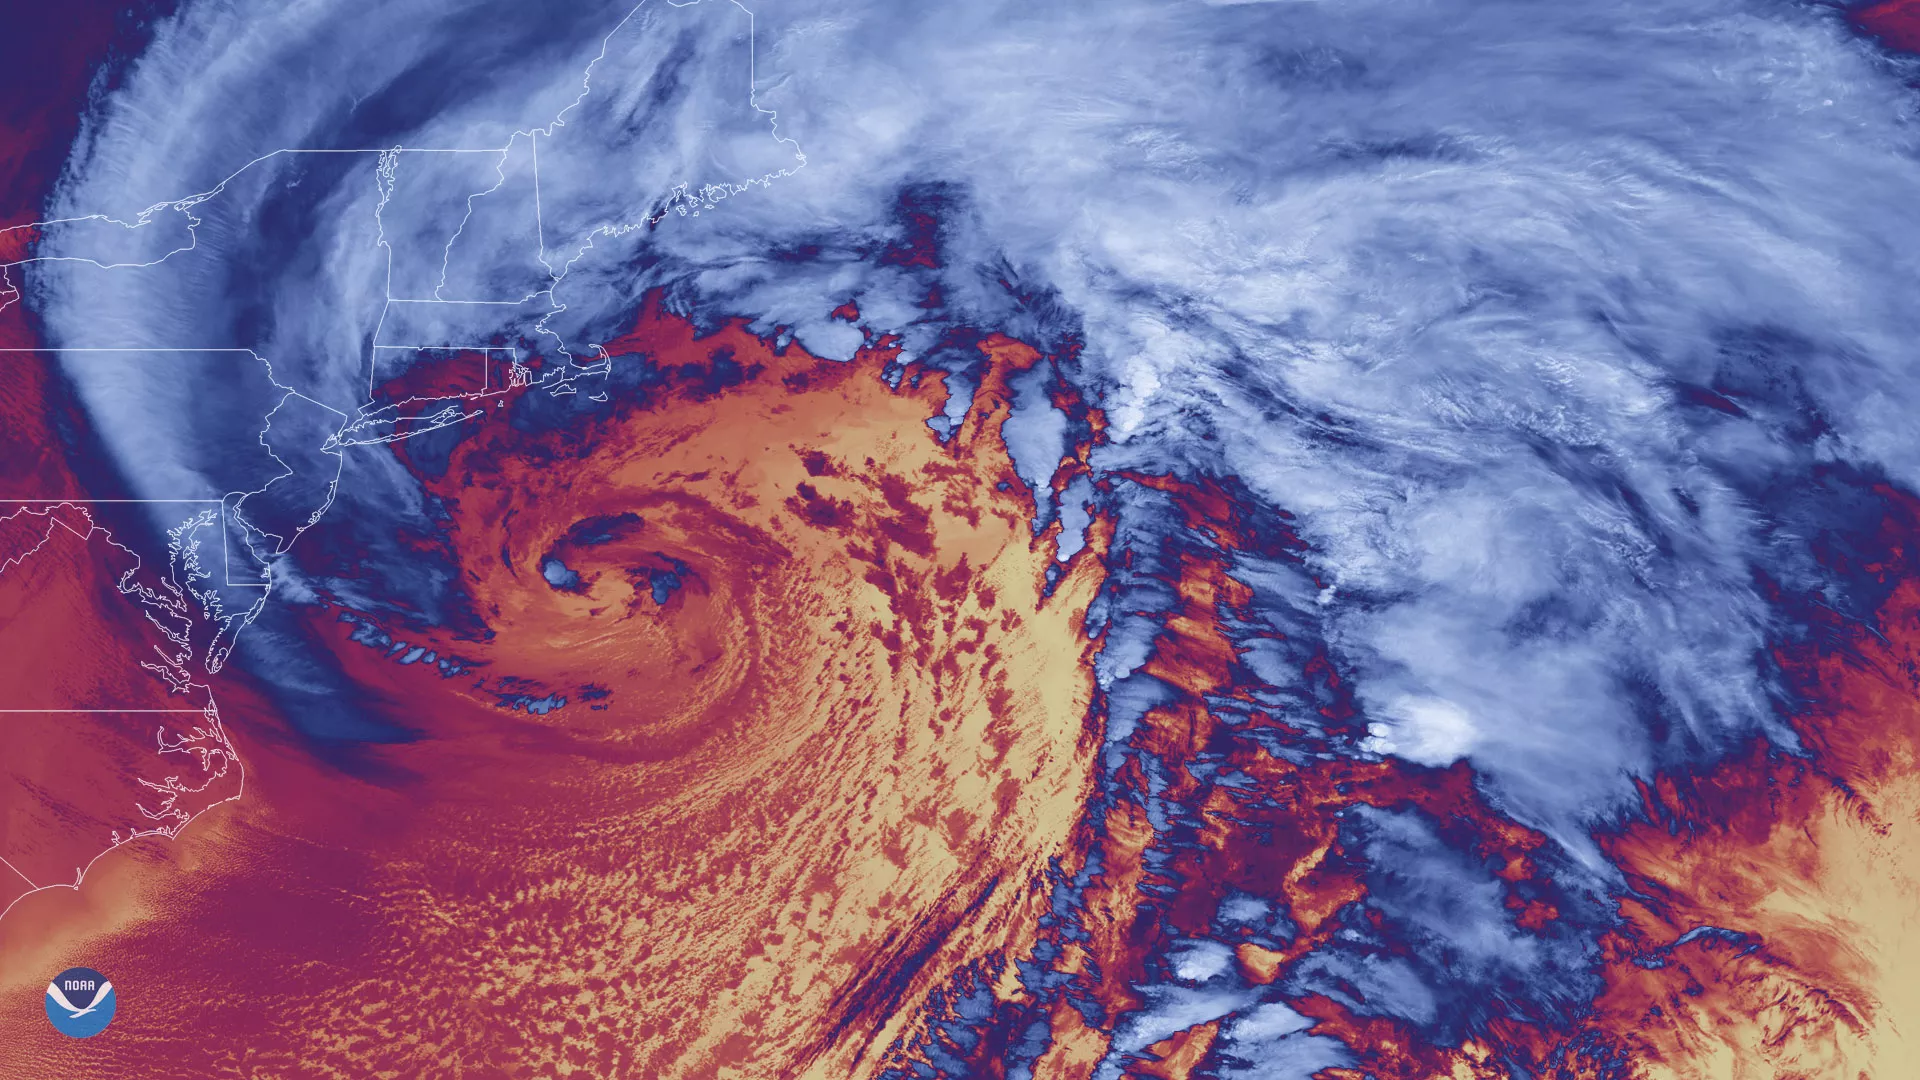
Forty-seven days after it was first launched, the NOAA-20 polar-orbiting satellite sent back its first thermal infrared images on January 4, 2018. This VIIRS thermal infrared image shows stunning detail of the powerful 'bomb cyclone' that struck the East Coast of North America on Jan. 2-3, 2018. The powerful winter nor'easter delivered snow and ice, 50 to 80 mph wind gusts, and strong surf from northern Florida to Nova Scotia, Canada. Due to its rapid intensification (the barometric pressure at the center of the storm dropped 59 millibars in 24 hours), the storm ranks among the strongest ever observed along the East Coast.
Infrared satellite imagery, which detects heat radiating off of clouds and the surface of the Earth, can help meteorologists detect certain features of the storm. This image was created from the VIIRS M15 radiometric band, which is sensitive to changes in atmospheric temperature. In this thermal infrared image, blue and white indicate the coldest sectors of the storm, while the red and yellow shades indicate relatively warmer ocean and land surface temperatures. The whitest shades show the coldest and highest cloud-top heights, which are associated with more intense storm activity.
