

This activity encourages students to use JPSS maps, data, and imagery to solve the mystery of a missing person using clues in an escape room style. Students will be exposed to actual satellite imagery of the ocean and test their graph reading skills.
National Oceanic and Atmospheric Administration (NOAA)’s Joint Polar Satellite System (JPSS) satellites help observe Earth’s ocean. These observations give scientists more information about the weather, including hurricane and tropical storm forecasting. JPSS also records sea surface temperature and uses that data for coral reef bleaching forecasts. They also track ocean color, chlorophyll productivity, and harmful algal blooms which can injure fish, birds, and other marine life and may inhibit recreational use of water features.
The Visible Infrared Imaging Radiometer Suite (VIIRS) instrument aboard JPSS satellites reveals lights at night which can be used to spot illegal fishing vessels. Marine biologists use satellite imagery and climate data to study the congregation and migration patterns of the marine life they are tracking.
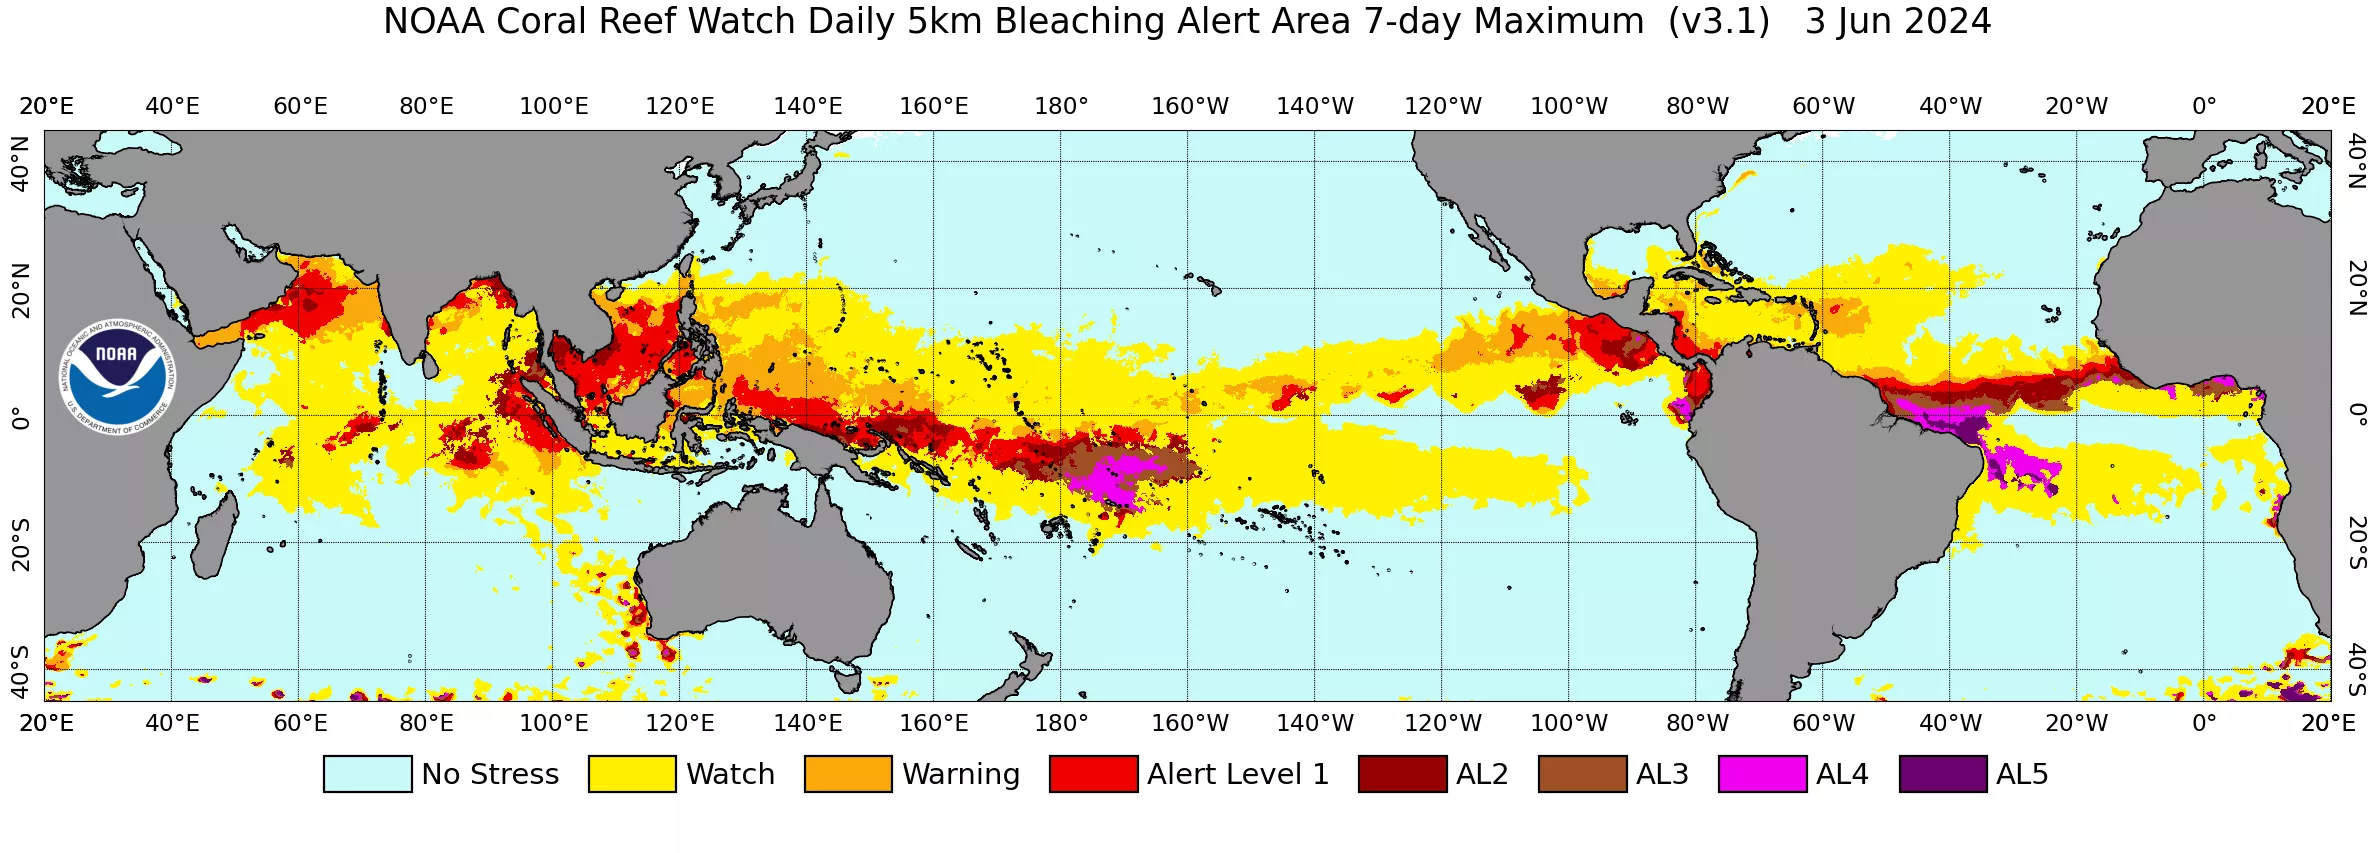
Above is an image of NOAA’s Coral Reef Watch on June 3, 2024. Coral reef bleaching occurs when extreme ocean temperatures kill the symbiotic algae that live on reefs. Bleaching can cause disease and eventually death. Rising sea surface temperatures are causing more widespread bleaching events. These images can be found at Coral Reef Watch.
Objective
This activity encourages students to use JPSS maps, data, and imagery to solve the mystery of a missing person. Students will be exposed to actual satellite imagery of the ocean and test their graph reading skills.
Materials:
- Printed copies of the maps and clues
- Envelopes or folders to separate the clues
- Colored pencils, markers, or crayons in red, yellow, and blue
Instructions
This activity should be done in small groups of 3-5 learners. They will use the materials to track down the location of environmentalist, Leonora “Leo” DelMar. Wait for the group to answer each question before giving them the next clue and set of maps. An optional “Bonus Clue” is provided to help narrow down the location if a group gets stuck. This mystery was designed to be solved in about 10 - 15 minutes and a timer can be used to increase the challenge.
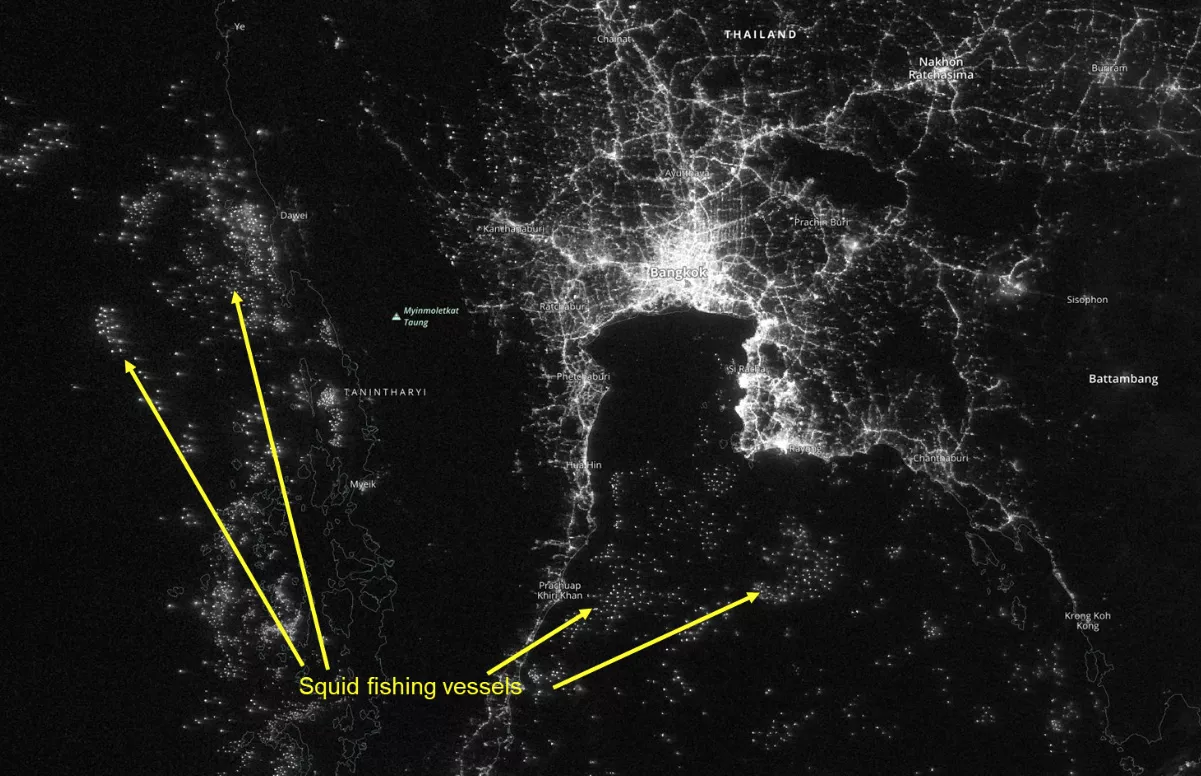
Above is an example of imagery showing the “Dark Fleet.” The night-time imagery from the Visible Infrared Imaging Radiometer Suite (VIIRS) instrument aboard JPSS satellites exposes a large number of unregulated squid fishing vessels in the Indian Ocean.
Hints, tips, and tricks
Mission Brief
Allow the participants to read and absorb the information about the activity and answer any questions they might have before giving them the first clue. If you are using a timer, don’t start the clock until after they’ve read and understood this card.
Clue 1
Players will need to color in the map to reveal the three digit number. Squares with a “B” should be colored blue. Squares with an “R” should be colored red. Squares with a “Y” should be colored yellow. This will reveal the code, “351.”
Clue 2
Participants will need to pick three of the zones on the map before you give them Clue 3. These zones show the dark fleet of fishing vessels as indicated by red dots. They can pick any three they’d like because they will narrow down these areas in the next clue. Although most people ignore the NOAA-20 VIIRS Day-Night Band map, it actually provides an extra hint since Leo thought North America and South America were important enough to save that map in her desk. The three zones in Alaska, Florida, and Central America are the best zones to start with! Keep the zone map out for the rest of the game since they will need to refer back to it.
Clue 3
These clues and maps help narrow down Leo’s location. The clue says that Leo is going somewhere the ocean is “a toasty 32 degrees Celsius.” The ocean temperature map key reveals that 32 degrees Celsius is indicated by the darkest color of red. Some participants only look at the numbers so you can choose to remind them that she could be in any dark red location even if it isn’t marked. This narrows down the zones to either Florida or Central America. The voicemail message also mentions that Leo was previously planning to travel to another location but that area is experiencing some dangerous weather. The maps show that a hurricane is headed to Florida. Leo wouldn’t want to be on a small boat in a hurricane so that indicates she’s not in Florida. Therefore we know that Leo is in Central America.
Bonus Clue
If students are struggling because they picked the wrong zones to investigate then you can give them this bonus clue to narrow it down further. This clue shows them that Leo is not in Alaska or Florida because those areas are experiencing harmful algal blooms. Combining this information with the ocean temperature map should lead them to choose Central America as her destination.
Discussion Questions
After the participants have solved the mystery you can discuss some of the maps and imagery they used to see what they have learned.
- What is the dark fleet?
- What is sargassum? Is sargassum good or bad for the environment?
- What is an algal bloom? Do they only form in the ocean? What can make an algal bloom “harmful?”
- Why is the ocean warmer in the middle of the map and cooler near the edges?
- What are some advantages of using satellite imagery to study the ocean?